Single-Cell Transcriptomic Analysis Reveals Diverse Cellular and Pathway Dysregulation in Mouse Colitis
This report details a comprehensive single-cell RNA sequencing analysis of mouse colon tissue, comparing healthy controls with acute and chronic colitis. We identified profound shifts in immune cell populations, particularly B cells and macrophages, alongside significant changes in intestinal epithelial and stromal cell states. Our findings highlight extensive dysregulation of inflammatory pathways and cell-cell communication networks that drive the pathology of acute and chronic colitis, offering insights into disease mechanisms and potential therapeutic targets.
Contents
- Dataset overview
- UMAP Visualization of Cell Populations by Condition, Sample, and Cell Type
- UMAP Visualization of Major Cell Type Scores and Annotations
- Marker Expression Dot Plot for Cell Subtype Annotation Validation
- Minor Cell Type Population Shifts in Colitis Conditions
- T Cell and Innate Lymphoid Cell Subpopulation Shifts in Acute and Chronic Colitis
- Differential Proportions of T Cell Subsets and ILC3(-) in Mouse Colitis Conditions
- Macrophage Subset Population Analysis in Colitis
- Analysis of Macrophage Subset Population Changes in Colitis
- Cell-Cell Interaction Patterns in Mouse Colon Under Colitis Conditions
- Differential Cell-Cell Interaction Patterns in Mouse Colon Colitis Models
- Condition-Specific Surfaceome Markers in Intestinal Epithelial Cells
- Macrophage Condition-Specific Surfaceome Markers in Colitis
- Fibroblast Condition-Specific Surfaceome Markers in Colitis
- T cell CD4+ Condition-Specific Surfaceome Markers in Colitis
- Gene Ontology (GSA) Analysis of Intestinal Epithelial Cells in Colitis
- Gene Set Enrichment Analysis of Colitis Conditions Across Colon Cell Types
- Discussion
- Query List
0. Dataset overview
Dataset Summary
- Data Type: Single-cell RNA-seq data (AnnData format).
- Dimensions: Contains 84,594 cells and 21,984 genes.
- Species & Tissue: Derived from mouse colon tissue.
- Conditions: Includes three conditions: AC (Acute Colitis), CC (Chronic Colitis), and HC (Healthy Control). HC is designated as the reference condition for differential analyses.
- Cell Type Annotations: Cells are annotated at three hierarchical levels: celltype_major, celltype_minor, and celltype_subset.
- Major Cell Types: Myeloid cell, T cell, B cell, Stromal cell, Endothelial cell, Intestinal Epithelial cell, unassigned.
- Minor Cell Types: Macrophage, ILC, B cell, Fibroblast, T cell CD4+, Endothelial cell, Intestinal Epithelial cell, unassigned, Dendritic cell, Plasma cell, Smooth muscle cell, T cell CD8+, NK cell.
- Subset Cell Types: Macrophage (M2B), ILC2, B cell (Follicular), Fibroblast, T cell (Treg), Endothelial cell, Microfold cell, Endothelial tip cell, ILC3 (NCR+), T cell (Th1), Macrophage (M2C), Macrophage (M1), Lymphatic Endothelial cell, ILCreg, B cell (Memory), ILC1, Macrophage (M2D), Enterocyte, T cell (Th9), T cell (Th22), T cell (Naive), LTI, unassigned, T cell (Th17), DC (Plasmacytoid), Plasma cell, DC (Inflammatory), T cell (Tfh), Paneth cell, Macrophage (M2A), DC (Classical), Smooth muscle cell, Goblet cell, T cell (Cytotoxic), B cell (MZ), T cell (Th2), ILC3 (NCR-), Tuft cell, NK cell, B cell (Breg), Crypt cell, Enteroendocrine cell, Enterochromaffin cell.
- Precomputed Results: The dataset includes precomputed results for various analyses:
- Cell-Cell Interaction (CCI): uns['CCI'] (per condition) and uns['CCI_sample'] (per sample).
- Differential Expression Genes (DEG): uns['DEG'] (one condition vs. rest) and uns['DEG_vs_ref'] (condition vs. reference HC) for each celltype_minor.
- Gene Set Enrichment Analysis (GSEA): uns['GSEA'] (one condition vs. rest) and uns['GSEA_vs_ref'] (condition vs. reference HC) for each celltype_minor.
- Gene Ontology (GO/GSA): uns['GSA_up'] (one condition vs. rest) and uns['GSA_vs_ref_up'] (condition vs. reference HC) for each celltype_minor.
- CNV Estimates: Copy Number Variation estimates are not available in this dataset.
- Inferred Context: The dataset is inferred to be related to Colitis research, based on the mouse colon tissue origin and the AC/CC/HC conditions.
1. UMAP Visualization of Cell Populations by Condition, Sample, and Cell Type
[Analysis Visualization Results]...
Analysis Overview
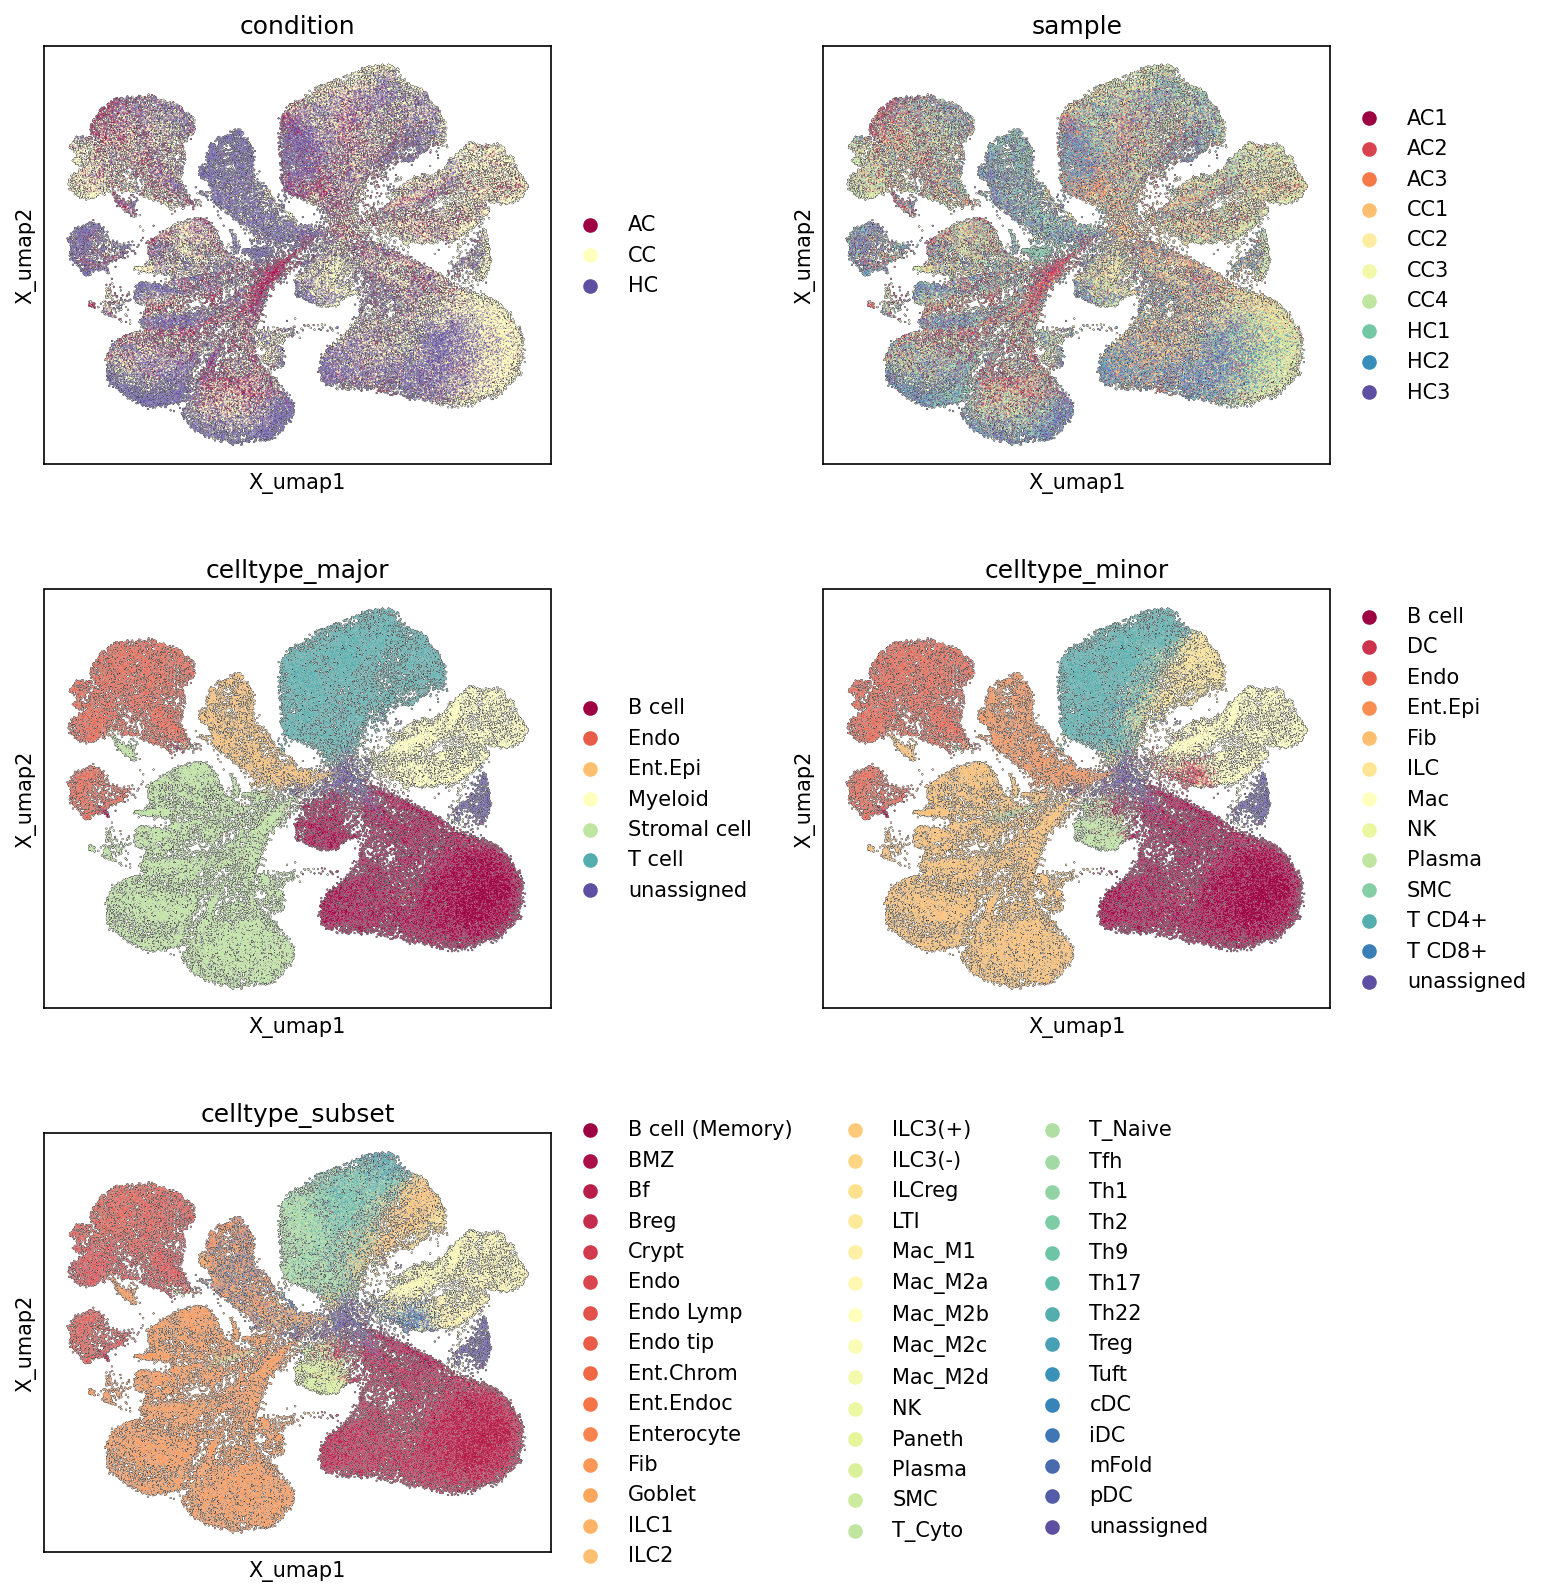
This analysis presents Uniform Manifold Approximation and Projection (UMAP) plots, which are dimensionality reduction techniques used to visualize high-dimensional single-cell RNA-seq data in two dimensions. The UMAPs display the relationships between 84,594 cells from mouse colon tissue, colored by various metadata annotations: experimental condition, individual sample, major cell type, minor cell type, and cell type subset. This visualization helps to assess the overall structure of the dataset, identify distinct cell populations, and evaluate potential batch effects or condition-specific clustering.
Visual Summary
- Condition UMAP: The UMAP colored by condition (Acute Colitis (AC), Chronic Colitis (CC), Healthy Control (HC)) shows distinct but also overlapping distributions. The Healthy Control (HC) cells tend to cluster somewhat separately, particularly forming distinct populations on the left side of the UMAP, while Acute Colitis (AC) and Chronic Colitis (CC) cells show significant overlap with each other, especially in the central and right-hand regions. This suggests that while there are condition-specific cellular states, particularly for HC, AC and CC share many underlying transcriptional profiles, consistent with both representing forms of colitis.
- Sample UMAP: The UMAP colored by sample shows a generally good mixing of samples within their respective conditions, without strong indications of batch effects where individual samples would form completely isolated clusters. For instance, cells from different HC samples (HC1, HC2, HC3) largely intermingle, as do cells from AC and CC samples. This suggests that the biological variation between conditions is more dominant than technical variation between samples.
- Celltype Major UMAP: This plot reveals well-separated major cell type clusters. For example, Myeloid cells, T cells, B cells, and Intestinal Epithelial cells each form large, relatively discrete clusters, indicating robust cell type identification at the major level. Stromal and Endothelial cells also form distinct, though perhaps smaller, clusters. This demonstrates effective initial clustering and annotation.
- Celltype Minor UMAP: Further resolution into celltype_minor shows that the major cell type clusters are composed of more granular, yet still distinct, minor cell populations. For instance, the large "T cell" major cluster resolves into T cell CD4+, T cell CD8+, and NK cell populations. Similarly, Myeloid cells resolve into Macrophage and Dendritic cell clusters. Intestinal Epithelial cells (Ent.Epi) remain largely cohesive, with some internal structure visible. The overall separation of these minor cell types is good, supporting the refined annotation.
- Celltype Subset UMAP: At the highest resolution, the celltype_subset UMAP further refines the populations into highly specific cell states. For example, Macrophages (Mac_M1, Mac_M2a, M2b, M2c, M2d) now resolve into several sub-clusters within the broader Macrophage population, suggesting distinct polarization states or activation profiles. T cells further differentiate into various T helper subsets (Th1, Th2, Th9, Th17, Th22, Treg), cytotoxic T cells (T_Cyto), and naïve T cells (T_Naive). Intestinal Epithelial cells also show distinct subsets like Enterocytes, Goblet cells, Paneth cells, and Crypt cells. The ability to distinguish these fine-grained subsets indicates a rich and well-resolved dataset, particularly valuable for understanding nuanced biological processes.
Biological Interpretation
The UMAP visualizations provide crucial insights into the cellular landscape of the mouse colon in the context of colitis.
- Colitis-associated Cellular States: The overlap between AC and CC conditions suggests that while there might be differences in the acute versus chronic phases of colitis, many underlying cellular responses and states are shared. In contrast, the partial separation of HC cells indicates that both AC and CC conditions induce significant transcriptional changes that distinguish them from a healthy state, consistent with the inferred disease context of colitis. The regions where AC and CC cells cluster separately from HC likely represent inflammatory cell states or shifts in cell composition characteristic of colitis.
- Robust Cell Type Identification: The clear separation of major, minor, and subset cell types on the UMAPs confirms the high quality of the single-cell clustering and annotation. This hierarchical annotation allows for investigations at different levels of granularity, from broad immune responses to specific functional states of cell subsets, which is critical for dissecting complex diseases like colitis. The identification of various immune cell subsets (e.g., Macrophage M1/M2 subtypes, T helper subsets, ILCs) is particularly relevant for understanding the immune dysregulation in inflammatory bowel diseases.
- Implications for Disease Heterogeneity: The ability to resolve distinct cell type subsets, such as different macrophage polarization states or T cell helper subsets, highlights the cellular heterogeneity within the colon. This heterogeneity is known to play a significant role in the pathogenesis and progression of colitis, where specific immune cell populations mediate inflammation or contribute to tissue repair. For example, the presence and distribution of different macrophage subtypes (M1, M2a-d) could reflect varying immune environments associated with different stages or types of colitis.
Annotation Notes
The UMAP plots demonstrate robust clustering and high-quality cell type annotations at major, minor, and subset levels. The distinct separation of cell populations across these hierarchical annotations suggests that the initial clustering and subsequent manual or automated annotation steps were effective. The mixing of samples within conditions, along with the separation of conditions, indicates that the biological signal (disease state) is well captured without significant confounding by technical batch effects. The unassigned cells are minimal and do not form large, cohesive clusters, suggesting most cells have been appropriately categorized.
2. UMAP Visualization of Major Cell Type Scores and Annotations
[Analysis Visualization Results]...
Analysis Overview
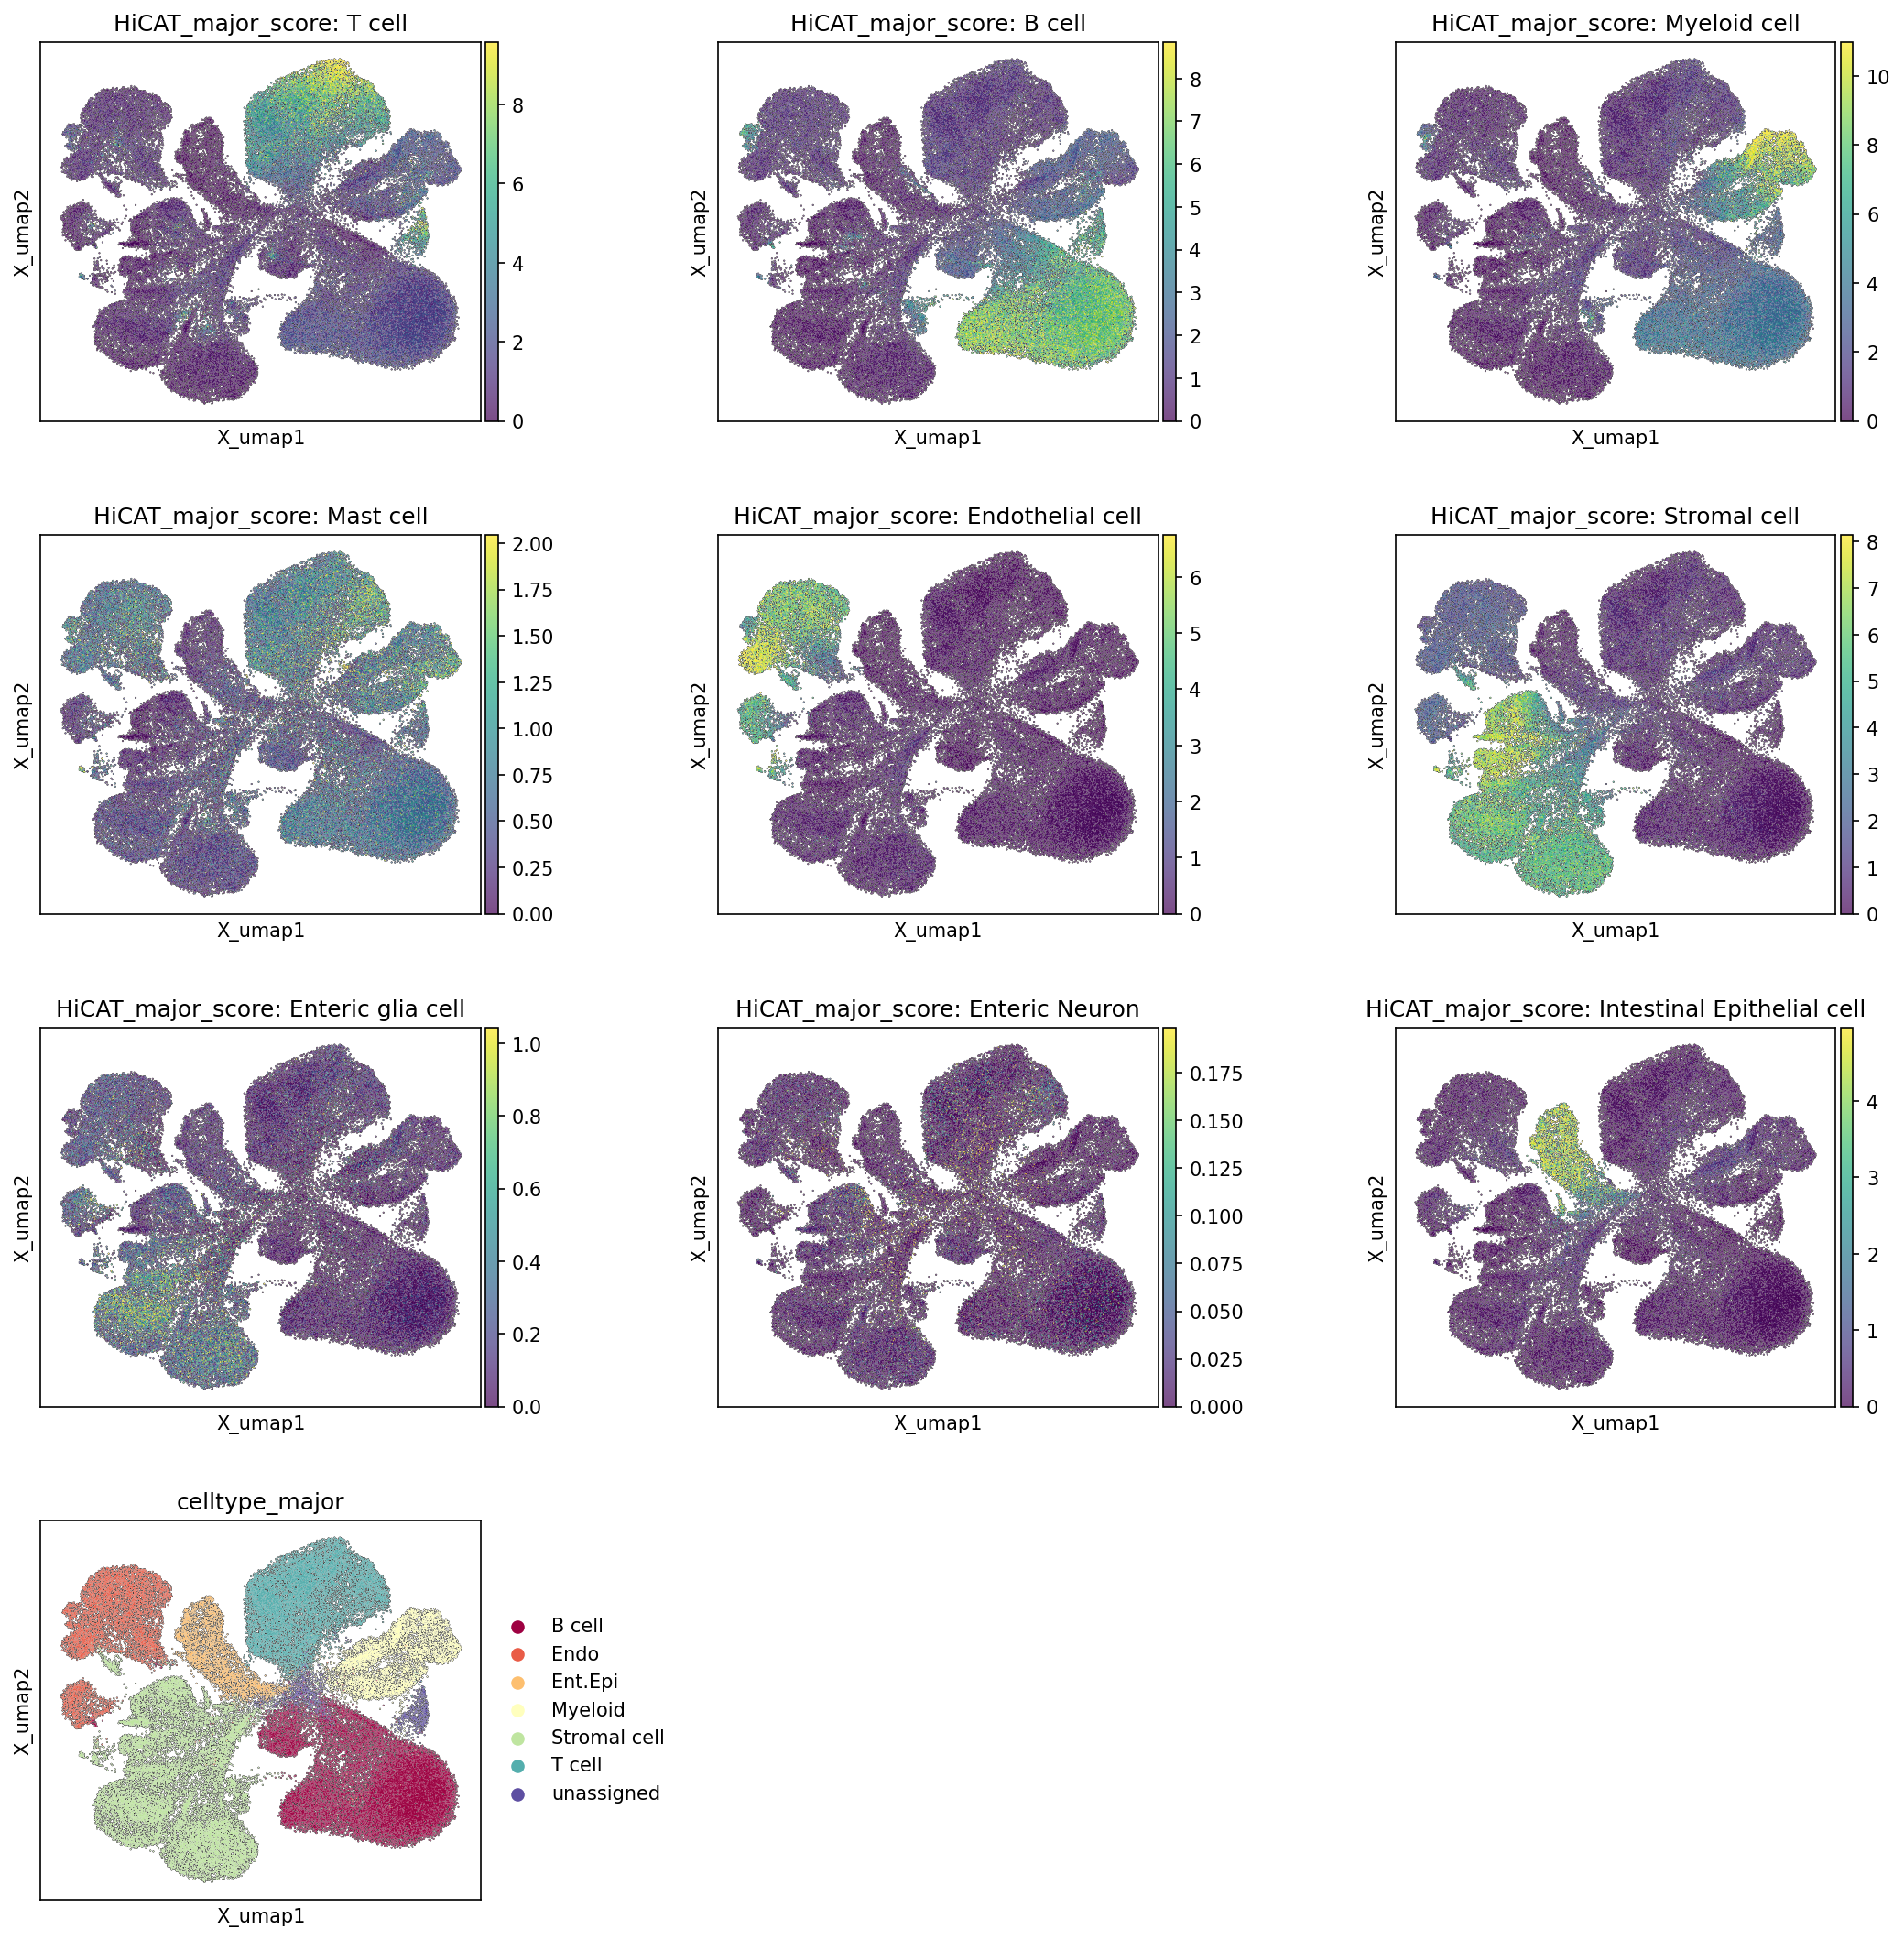
This analysis presents UMAP (Uniform Manifold Approximation and Projection) visualizations to illustrate the distribution of major cell types based on their computed HiCAT_major_score and the final celltype_major assignments across the single-cell RNA-seq dataset from mouse colon tissue. Each HiCAT_major_score plot displays the intensity of the transcriptional signature for a specific major cell type, with higher scores (yellow/green) indicating a stronger match to that cell type's profile. The final UMAP plot shows the assigned celltype_major for each cell, color-coded for distinct populations. This analysis serves to validate the cell type annotations and assess the overall structure and identity of cell populations within the dataset.
Visual Summary
The UMAP plots effectively delineate distinct cellular populations based on their gene expression profiles.
Immune Cell Populations
- T cells: Cells with high HiCAT_major_score: T cell are predominantly localized in a distinct cluster in the upper-left region and a smaller cluster towards the bottom-middle of the UMAP, which align perfectly with the "T cell" (teal) population in the celltype_major plot.
- B cells: A clear and separate cluster in the bottom-left of the UMAP shows high HiCAT_major_score: B cell values, corresponding to the "B cell" (maroon) population.
- Myeloid cells: A large, well-defined cluster on the central-right side of the UMAP exhibits high HiCAT_major_score: Myeloid cell, consistently assigned as "Myeloid cell" (light yellow).
- Mast cells: The HiCAT_major_score: Mast cell plot shows a relatively lower overall score range (max ~2.0) and a more diffuse distribution compared to other major immune cells, with slight enrichments in specific areas, suggesting these are either less abundant or have less distinct major-type signatures, potentially subsumed under broader categories like Myeloid cells or unassigned in the final annotation.
Structural and Epithelial Cell Populations
- Intestinal Epithelial cells: A robust and distinct cluster on the far-left of the UMAP displays high HiCAT_major_score: Intestinal Epithelial cell, accurately reflected by the "Int.Epi" (orange) cluster in the celltype_major plot.
- Stromal cells: A broad population primarily in the bottom-right and extending upwards shows high HiCAT_major_score: Stromal cell, corresponding to the "Stromal cell" (light green) cluster.
- Endothelial cells: A small, well-separated cluster in the upper-middle-left region exhibits high HiCAT_major_score: Endothelial cell, matching the "Endo" (beige) population.
Rare or Less Distinct Populations
- Enteric glia cells and Enteric Neurons: The HiCAT_major_score plots for Enteric glia cell and Enteric Neuron show very low score ranges (max 1.0 and 0.175 respectively) and highly diffuse distributions across the UMAP, indicating that these populations are either extremely rare, their transcriptional signatures are less distinct at this major cell type level, or they are not resolved into discrete clusters in the celltype_major annotation (likely falling into unassigned or within stromal compartments).
- Consistency of Annotation: The final celltype_major UMAP plot demonstrates excellent agreement with the individual HiCAT_major_score distributions. Each color-coded cluster in the celltype_major plot broadly overlaps with regions of high scores for its corresponding major cell type in the HiCAT_major_score plots. The "unassigned" population (purple) in the celltype_major plot occupies regions where scores for specific major cell types are generally low or mixed, or where cell identities are ambiguous.
Biological Interpretation
The UMAP visualization confirms a comprehensive and well-resolved representation of major cell types within the mouse colon single-cell dataset. The clear segregation of key immune cell populations (T, B, Myeloid cells) and major tissue-resident cells (Intestinal Epithelial, Stromal, Endothelial cells) highlights the robustness of the clustering and annotation process. This clear separation is crucial for subsequent analyses, especially in the context of colitis, where dynamic changes in immune cell composition and epithelial responses are expected. The presence of relatively rare cell types like Mast cells, Enteric glia cells, and Enteric Neurons, even if not forming highly distinct major clusters, indicates the capture of broad cellular diversity, which could be important for understanding neuro-immune interactions or specific inflammatory responses in the colon. The high concordance between HiCAT_major_score and celltype_major assignments provides strong confidence in the initial cell type identifications, forming a solid basis for further in-depth differential expression, pathway analysis, or cell-cell interaction studies related to acute and chronic colitis.
Annotation Notes
The consistency between the HiCAT_major_score plots and the final celltype_major annotations indicates a high quality of cell identity assignment for the major cell types. The distinct clustering and high scores for prominent populations like T cells, B cells, Myeloid cells, Intestinal Epithelial cells, Stromal cells, and Endothelial cells suggest that these annotations are robust and reliable. The presence of an unassigned category is appropriate for cells that do not clearly fit into major predefined categories, which could include rare cell types, transitional states, or cells with ambiguous transcriptional profiles. For populations like Mast cells, Enteric glia cells, and Enteric Neurons, which show lower scores or diffuse distributions, further investigation at the celltype_minor or celltype_subset level using more specific markers might be necessary to confirm their precise identity and delineate their distinctness, particularly if they are functionally relevant to the biological context of colitis. The current major cell type resolution provides an excellent overview and foundation for deeper dives into specific cell lineages.
3. Marker Expression Dot Plot for Cell Subtype Annotation Validation
[Analysis Visualization Results]...
Analysis Overview
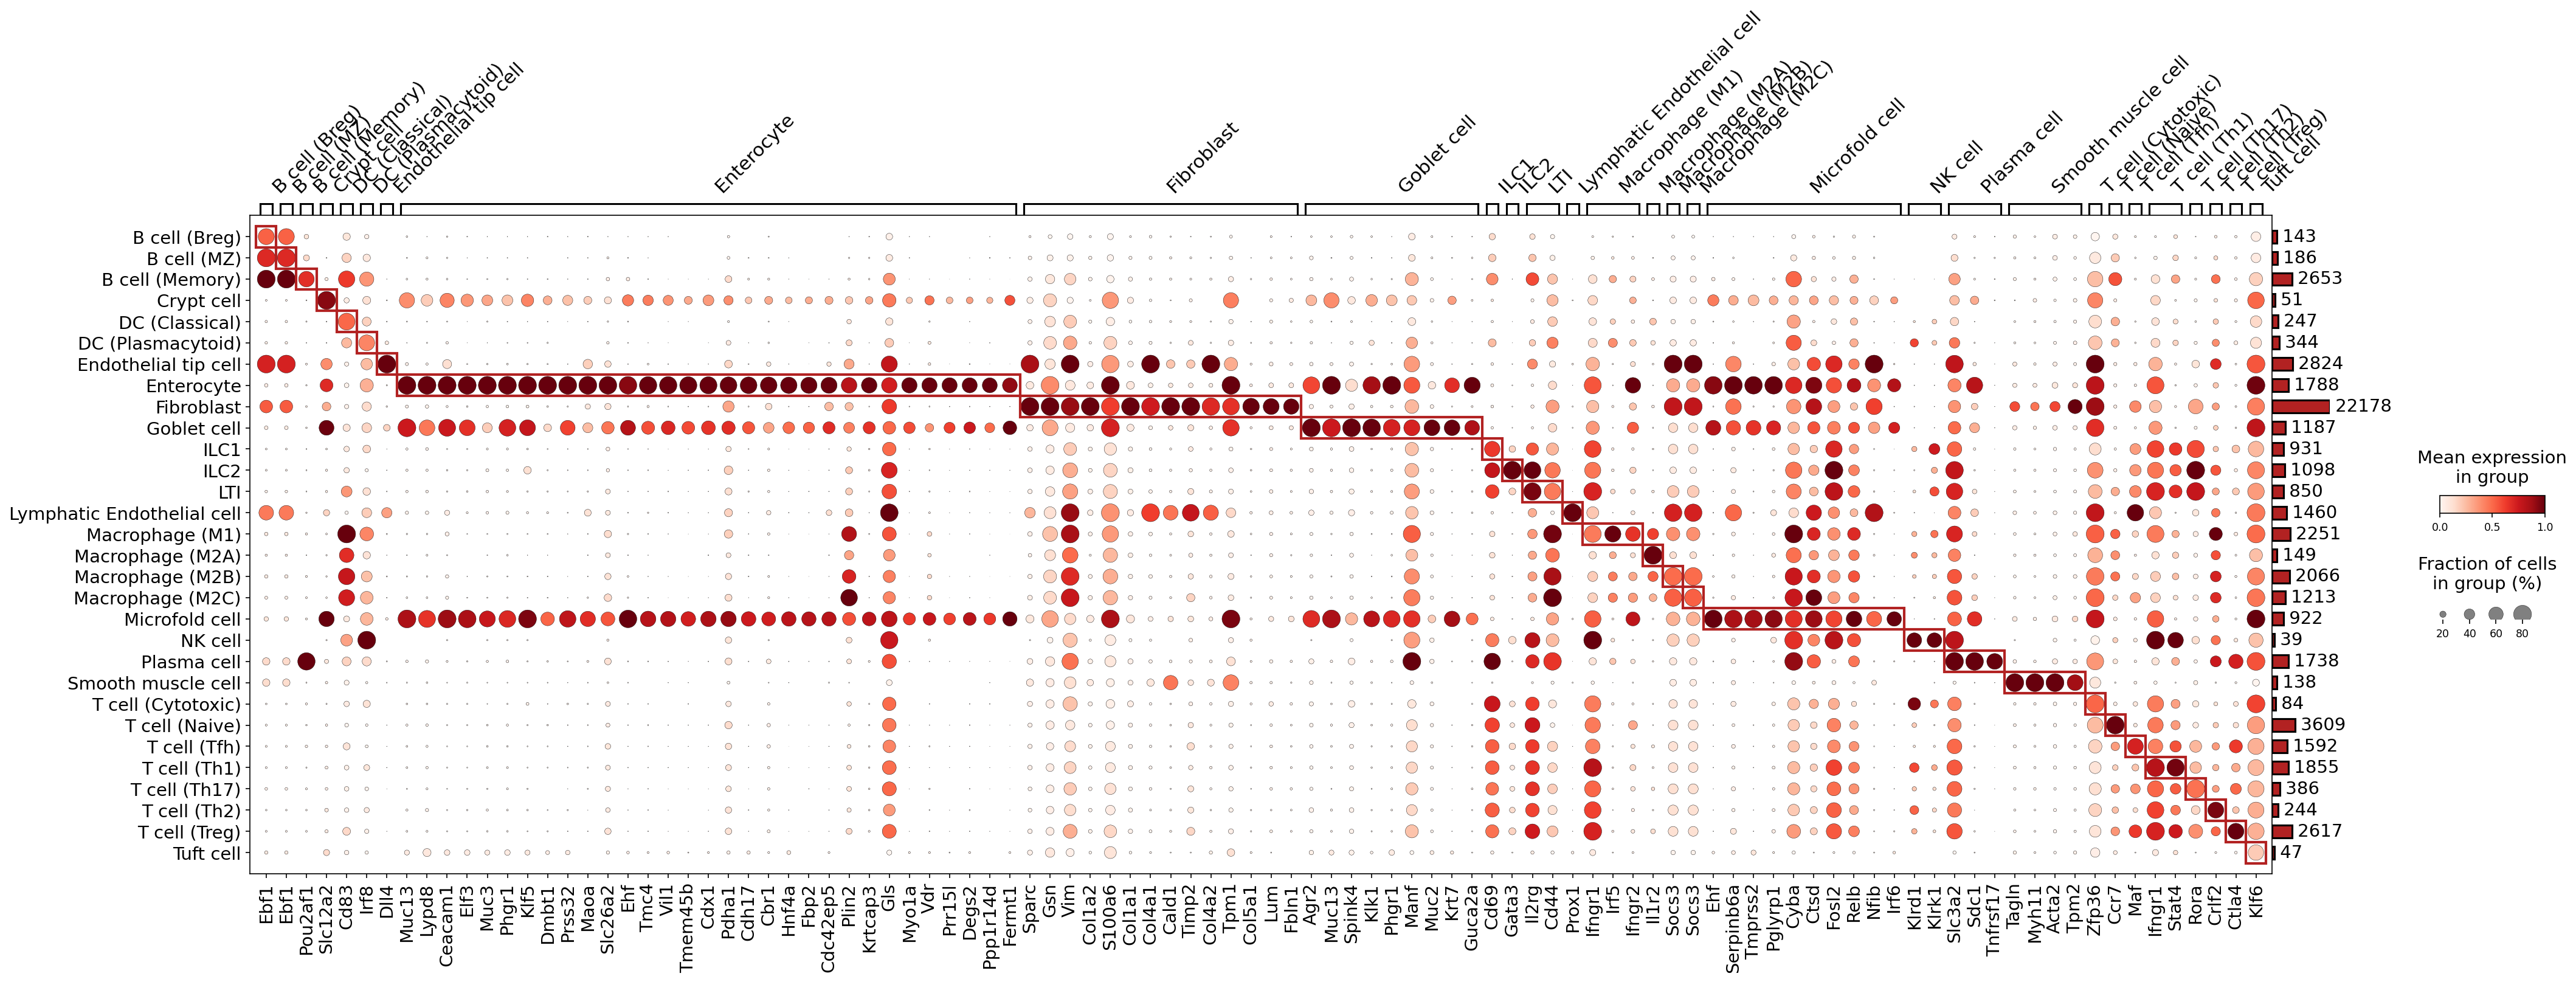
This analysis presents a dot plot visualizing the expression of selected marker genes across various celltype_subset populations identified in the single-cell RNA-seq data from mouse colon tissue. The primary goal of this visualization is to validate the assigned cell type annotations by examining whether each celltype_subset exhibits a distinct and biologically coherent gene expression signature. The dot size represents the fraction of cells within each group expressing a given gene, while the color intensity indicates the mean expression level of that gene in the group.
Visual Summary
The dot plot effectively illustrates the expression patterns of a comprehensive panel of marker genes across 36 distinct celltype_subset populations. Key observations include:
- Distinct Cell Type Clusters: Most celltype_subset populations display unique and concentrated patterns of marker gene expression, forming visually distinct blocks of highly expressed genes. These blocks are often highlighted by red boxes, indicating groups of genes particularly specific to certain cell types or closely related cell lineages.
- Graded Expression and Specificity: Marker genes show varying degrees of specificity, with some genes being highly restricted to a single cell type (e.g., Prox1 in Lymphatic Endothelial cells, Muc2 in Goblet cells), while others are expressed across related cell types (e.g., general B cell markers, pan-epithelial markers).
- Fraction of Expressing Cells vs. Mean Expression: The combination of dot size and color provides a nuanced view. Large, dark red dots signify markers that are highly expressed in a large fraction of cells within a specific population, serving as strong indicators of cell identity. Smaller or lighter dots may suggest lower expression levels, lower prevalence, or more general cellular functions.
- Cell Type Hierarchies: The organization of cell types along the y-axis and genes along the x-axis reveals expected relationships. For example, various B cell subtypes group together with common B cell markers, and different Intestinal Epithelial cell subtypes share a large set of epithelial-specific genes while also possessing unique markers.
Biological Interpretation
The observed marker expression patterns largely confirm the biological identities of the annotated celltype_subset populations, aligning well with established knowledge of cell-specific gene expression in the colon:
Immune Cells:
- B cells and Plasma cells: Ebf1 and Pou2af1, critical transcription factors for B cell development, are highly expressed across B cell subsets (B cell (Breg), B cell (MZ), B cell (Memory)). Sdc1 (CD138), a definitive marker for plasma cells, is prominently expressed in Plasma cell.
- Dendritic cells: DC (Classical) cells display strong expression of Cd83, Irf8, and Dll4, consistent with their roles in antigen presentation and T cell activation.
- Macrophages: Distinct macrophage subtypes (Macrophage (M1), Macrophage (M2A), Macrophage (M2B), Macrophage (M2C)) show differential expression of genes like Irf5, Irf6, Ctsd, Fosl2, Timp2, and Socs3, reflecting their diverse functional states and polarization, which are often altered in inflammatory conditions like colitis.
- Innate Lymphoid Cells (ILCs) and NK cells: Gata3, a master regulator of ILC2 development and function, is highly specific to ILC2. Klrd1 is prominently expressed in NK cell and T cell (Cytotoxic), reflecting shared cytotoxic capabilities. Ifngr1 is noted in ILC1 and T cell (Th1), consistent with type 1 immunity.
- T cells: Ctla4 is specifically expressed in T cell (Treg), validating their immune-regulatory identity. Stat4 is seen in T cell (Th1) and Gata3 in T cell (Th2), indicating differentiation towards specific helper T cell lineages. Ccr7 shows expression in T cell (Naive), a marker for lymphoid homing. Myh11 and Acta2 define Smooth muscle cell, as expected.
- Stromal Cells: Fibroblast populations are characterized by robust expression of extracellular matrix (ECM) components and associated proteins such as Sparc, Vim, Col1a1, Col1a2, Col4a1, Col4a2, Col5a1, and Lum, consistent with their role in tissue structure and remodeling.
- Endothelial Cells: Prox1, a well-known lymphatic endothelial cell marker, is uniquely and highly expressed in Lymphatic Endothelial cell. Dll4 shows specificity for Endothelial tip cell, reflecting its role in angiogenesis and vascular sprouting.
- Intestinal Epithelial Cells: This broad category contains several specialized cell types showing distinct markers:
- Enterocyte cells express Cdx1, Hnf4a, Vil1, and Tmem45b, indicating their absorptive functions.
- Goblet cell are clearly marked by Muc2 and Fcgbp, involved in mucus production.
- Crypt cell show distinct expression of Klf5 and Prss32, genes associated with stemness and proliferation within the crypts.
- Microfold cell have specific markers like Mcam and Ctsd.
- Tuft cell show unique expression of Krtcap3 and Gls, supporting their roles in chemosensation and immune modulation.
Annotation Notes
The comprehensive marker expression dot plot strongly supports the high quality and biological consistency of the celltype_subset annotations within this single-cell RNA-seq dataset. The distinct gene expression profiles observed for most populations align well with known cell-type-specific markers, providing confidence in the cell identity assignments. The presence of expected lineage-specific transcription factors, surface markers, and functional genes confirms the biological integrity of the clustering and annotation process. While some markers may show expression across closely related cell types, the overall pattern for each celltype_subset is remarkably unique and informative, establishing a robust foundation for downstream analyses related to the inferred colitis context.
4. Minor Cell Type Population Shifts in Colitis Conditions
[Analysis Visualization Results]...
Analysis Overview
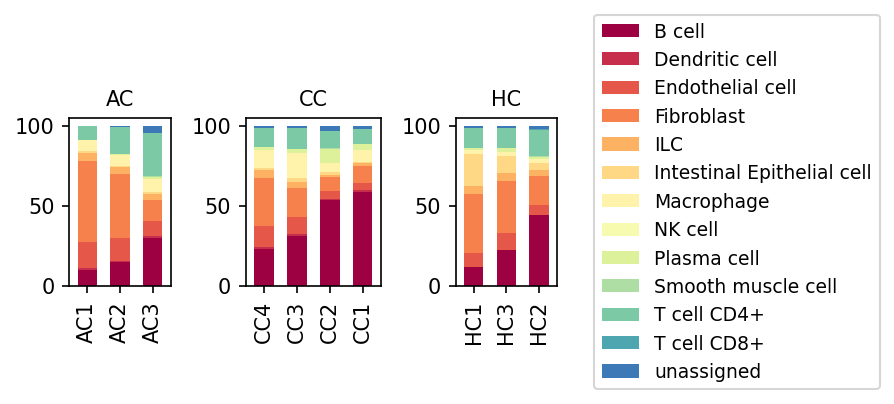
This analysis presents stacked bar plots illustrating the proportional distribution of minor cell types across individual samples from different experimental conditions: Acute Colitis (AC), Chronic Colitis (CC), and Healthy Controls (HC). Each bar represents a single sample, and the height of the colored segments within the bar indicates the relative abundance of each minor cell type, summing to 100% for each sample. The goal is to identify changes in cellular composition associated with acute and chronic colitis.
Visual Summary
The visualization reveals distinct shifts in the cellular landscape of the colon tissue across the different conditions.
- Healthy Control (HC): In healthy samples (HC1, HC3, HC2), the colon tissue shows a relatively balanced composition, with Intestinal Epithelial cells (light orange/yellow) and Fibroblasts (orange) forming substantial proportions. T cell CD4+ (mint green) and B cells (dark red) are present but in lower proportions compared to diseased states.
- Acute Colitis (AC): Samples from acute colitis (AC1, AC2, AC3) exhibit a noticeable increase in immune cell populations compared to HC. Most prominently, B cells (dark red) show an elevated proportion, as do T cell CD4+ (mint green) and potentially Macrophages (pale yellow) and Dendritic cells (red). Conversely, the proportion of Intestinal Epithelial cells appears to be reduced in AC samples.
- Chronic Colitis (CC): The most striking changes are observed in chronic colitis samples (CC4, CC3, CC2, CC1). Here, B cells (dark red) significantly expand, becoming a predominant cell type, often exceeding 50% of the total cell population in some samples (e.g., CC1, CC2). Concurrently, the proportion of Intestinal Epithelial cells appears further diminished compared to both HC and AC. Fibroblasts (orange) remain a substantial component, and T cell CD4+ (mint green) and Macrophages (pale yellow) also show increased presence, though less dramatic than B cells. There is some heterogeneity in B cell proportions within the chronic colitis samples.
Biological Interpretation
The observed changes in minor cell type populations align strongly with the inflammatory processes characteristic of colitis.
- Epithelial Barrier Dysfunction: The progressive decrease in the proportion of Intestinal Epithelial cells from HC to AC and then to CC strongly suggests epithelial damage, cell loss, or compromised barrier integrity, which is a hallmark of inflammatory bowel diseases (IBD) like colitis. This loss of epithelial cells contributes to increased permeability and chronic inflammation.
Immune Cell Infiltration and Activation:
- B cell Expansion: The significant increase in B cells, particularly in chronic colitis, points towards a robust humoral immune response. B cells can act as antigen-presenting cells, produce autoantibodies, and contribute to chronic inflammation and tissue damage through cytokine secretion. This is a known feature in some forms of IBD [1]. The presence of Plasma cells, though a smaller fraction, further supports active B cell differentiation.
- T cell Response: The sustained or increased proportions of T cell CD4+ and T cell CD8+ cells indicate an active adaptive immune response. CD4+ helper T cells are crucial drivers of inflammation in colitis, differentiating into various effector subsets (e.g., Th1, Th17) that produce pro-inflammatory cytokines, while CD8+ cytotoxic T cells can contribute to epithelial cell damage.
- Myeloid Cell Involvement: The slight increase in Macrophages and Dendritic cells, especially in the colitis conditions, reflects their roles as key innate immune cells that initiate and perpetuate inflammation by presenting antigens and secreting inflammatory mediators.
- Chronic Disease Signature: The more pronounced expansion of B cells and reduction of epithelial cells in chronic colitis (CC) compared to acute colitis (AC) suggests a transition from an acute inflammatory phase to a chronic, potentially B cell-mediated, disease state with sustained tissue damage and remodeling. The variability within CC samples could reflect differing disease activity or stages of chronicity.
Clinical or Translational Implications
The alterations in cellular composition provide valuable insights into colitis pathogenesis and potential therapeutic strategies.
- Biomarker Potential: The distinct shifts in cell proportions, particularly the dramatic increase in B cells and the decrease in Intestinal Epithelial cells, could serve as robust biomarkers for distinguishing between healthy, acute, and chronic colitis.
- Therapeutic Targets: The striking expansion of B cells in chronic colitis suggests that B cell-targeted therapies could be highly effective in managing this condition. Modulating B cell activation, survival, or antibody production might mitigate chronic inflammation. Similarly, strategies aimed at restoring intestinal epithelial integrity could be crucial.
- Disease Progression Monitoring: Monitoring these cellular population shifts over time could help assess disease progression, predict patient outcomes, and evaluate the efficacy of therapeutic interventions in colitis.
- Understanding Pathogenesis: Differentiating the cellular profiles of acute versus chronic colitis can inform our understanding of disease evolution and identify stage-specific pathogenic mechanisms, potentially leading to more tailored treatments.
---
References:
- B cells in IBD: For general information on the role of B cells in inflammatory bowel disease, see: https://pubmed.ncbi.nlm.nih.gov/30678997/
5. T Cell and Innate Lymphoid Cell Subpopulation Shifts in Acute and Chronic Colitis
[Analysis Visualization Results]...
Analysis Overview
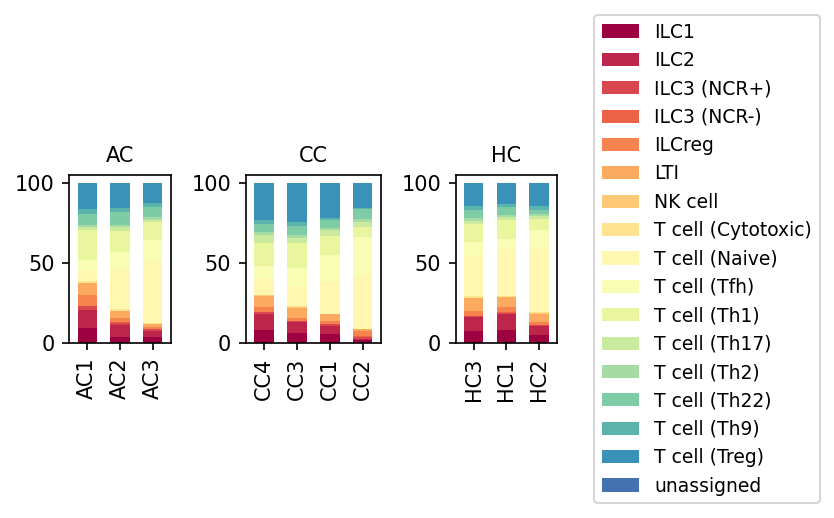
This analysis presents a population bar plot illustrating the relative proportions of T cell subsets and Innate Lymphoid Cells (ILCs) across individual samples from different experimental conditions: Acute Colitis (AC), Chronic Colitis (CC), and Healthy Controls (HC). The data is derived from single-cell RNA sequencing of mouse colon tissue, with cell populations defined at the 'subset' taxonomic level. This visualization allows for a comparative assessment of immune cell composition shifts in inflammatory bowel disease models.
Visual Summary
The stacked bar plots normalize the population percentages of T cell and ILC subsets to 100% for each sample. Key observations include:
- Reduction in Naive T Cells: T cell (Naive) populations (lightest yellow) show a noticeable reduction in both Acute Colitis (AC) and Chronic Colitis (CC) samples compared to Healthy Control (HC) samples.
Shifts in Effector T Cell Proportions:
- Pro-inflammatory T helper cell subsets, specifically T cell (Th1) (light green) and T cell (Th17) (mid-green), appear to be relatively increased in proportion in both AC and CC conditions compared to HC.
- T cell (Cytotoxic) (mid-yellow) maintains a substantial proportion across all conditions, perhaps slightly lower in AC/CC.
- T cell (Treg) (dark blue), critical for immune regulation, seems to maintain a relatively stable proportion, or possibly slightly increased in AC/CC, though this would need further statistical validation.
- Other Th subsets (Th2, Th9, Th22, Tfh) contribute smaller proportions, with some variability.
Changes in Innate Lymphoid Cell (ILC) Proportions:
- ILC1 (darkest red) and ILC2 (darker red) appear to be somewhat less prominent in AC and CC conditions compared to HC.
- Conversely, ILC3 populations, particularly ILC3 (NCR+) (red-orange) and ILC3 (NCR-) (orange-red), show a tendency to be relatively more abundant in both AC and CC samples compared to HC.
- NK Cell and Lymphoid Tissue Inducer (LTI) Cells: NK cells (orange-yellow) and LTI cells (orange) represent minor but consistent populations, with no major visually striking shifts, though NK cells might be slightly increased in AC/CC.
Biological Interpretation
The observed shifts in T cell and ILC populations are highly consistent with the known immunological landscape of colitis and inflammatory bowel diseases (IBD).
- Naive to Effector T Cell Transition in Colitis: The reduction in T cell (Naive) proportions in AC and CC conditions suggests an increased activation and differentiation of T cells into effector subsets within the inflamed colon. This is a hallmark of chronic inflammation, where naive cells are recruited to sites of inflammation and differentiate.
- Pro-inflammatory T Cell Dominance: The relative increase in T cell (Th1) and T cell (Th17) subsets in colitis models (AC and CC) is a well-established feature of intestinal inflammation. Th1 cells, through IFN-$\gamma$ production, and Th17 cells, through IL-17 and IL-22, play critical roles in driving the inflammatory cascade, contributing to tissue damage and barrier dysfunction characteristic of colitis [1, 2].
- Regulatory T Cell Homeostasis: The apparent maintenance or slight increase of T cell (Treg) populations could reflect a compensatory mechanism by the immune system to counteract the rampant inflammation. However, the functionality of these Tregs in an inflammatory environment would need further investigation, as their suppressive capacity can be impaired in colitis [3].
- ILC Dynamics in Gut Inflammation: The observed shift from ILC1/ILC2 towards ILC3 predominance in colitis conditions aligns with studies showing ILC3 expansion and their role in modulating gut inflammation. ILC3s, particularly ROR$\gamma$t+ ILC3s (which include both NCR+ and NCR- subsets), produce IL-17 and IL-22, which can be both protective (e.g., in maintaining barrier integrity) and pathogenic (e.g., contributing to inflammation, especially via IL-17) depending on the context and subtype [4]. The decrease in ILC1 and ILC2 might indicate a shift in the cytokine milieu towards Th1/Th17-type responses.
Clinical or Translational Implications
These findings provide valuable insights into the immune cell dynamics during acute and chronic phases of colitis, potentially informing therapeutic strategies:
- Therapeutic Targeting: The increased proportions of Th1 and Th17 cells, along with shifts in ILC3 populations, highlight these cells as potential targets for immunomodulatory therapies in IBD. Strategies aimed at suppressing Th1/Th17 responses or modulating ILC3 activity could be beneficial in reducing intestinal inflammation.
- Biomarker Identification: Changes in the ratios or absolute numbers of specific T cell and ILC subsets could serve as biomarkers for disease severity, prognosis, or response to treatment in colitis patients.
- Understanding Disease Progression: Differentiating between acute and chronic colitis based on the subtle differences in these immune cell profiles (e.g., specific shifts in ILC3s or particular Th subsets) could help in understanding disease progression and tailoring therapeutic approaches for different stages of the disease.
References
- Th1/Th17 in IBD: Neurath, M.F. (2014). New insights into the pathogenesis of inflammatory bowel diseases. *Annual Review of Medicine*, 65, 399-418. PubMed Search: "Th17 Th1 inflammatory bowel disease pathogenesis"
- IL-17 in IBD: Rovedatti, L., et al. (2009). IL-17A is a central mediator of inflammation in inflammatory bowel diseases. *Gastroenterology*, 136(7), 2415-2423.e1. PubMed Search: "IL-17 inflammatory bowel disease pathogenesis"
- Treg in IBD: Fantini, M.C., et al. (2004). T regulatory cells are increased in inflammatory bowel disease and are more resistant to apoptosis. *Gastroenterology*, 126(6), 1612-1621. PubMed Search: "Treg inflammatory bowel disease function"
- ILC3 in Gut: Cella, M., et al. (2009). A human ILC3 population that produces IL-17 and IL-22 and expresses the nuclear receptor RORγt. *Immunity*, 31(1), 159-170. PubMed Search: "ILC3 gut inflammation"
6. Differential Proportions of T Cell Subsets and ILC3(-) in Mouse Colitis Conditions
[Analysis Visualization Results]...
Analysis Overview
This analysis investigates changes in the proportions of various T cell subsets and an ILC population within mouse colon tissue across different conditions: Acute Colitis (AC), Chronic Colitis (CC), and Healthy Controls (HC). The proportions were compared using box plots, and statistical significance was determined to identify populations with significant differences between conditions. The inferred biological context is Colitis, with AC and CC representing acute and chronic inflammatory states, respectively.
Visual Summary
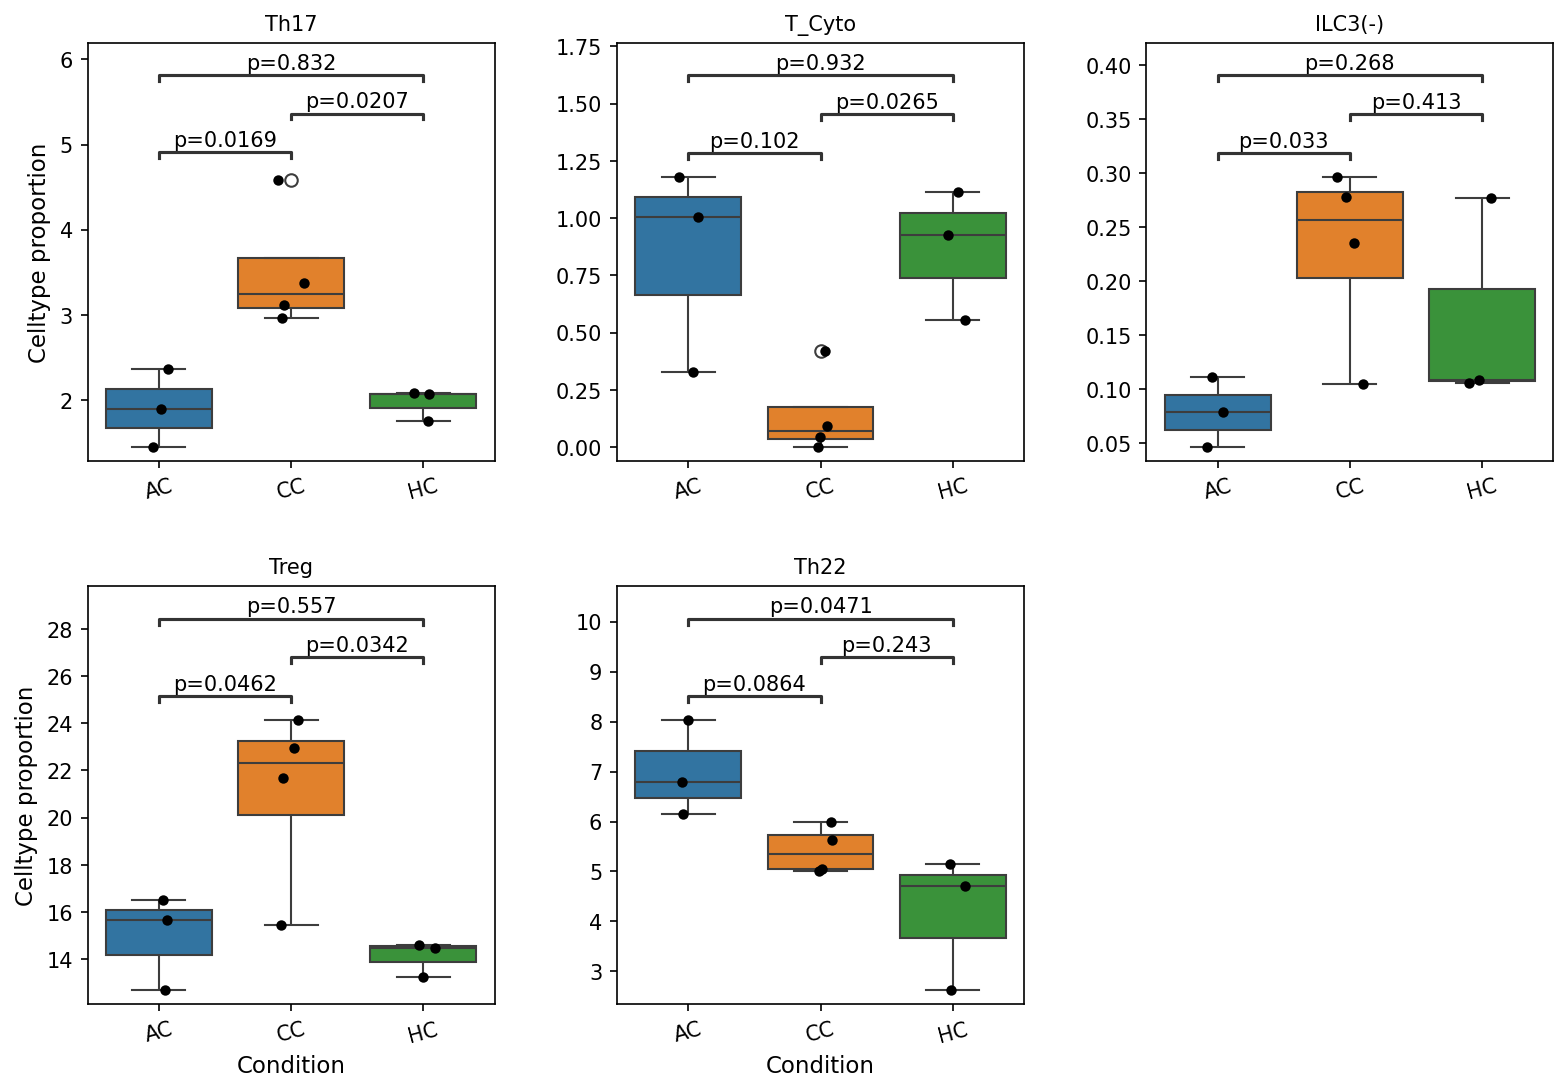
The box plots display the celltype proportion (as a percentage of total cells, or relative to the parent cell type, depending on how proportion was calculated, but generally relative abundance) for five distinct immune populations across the three conditions (AC, CC, HC). The populations include Th17 cells, Cytotoxic T cells (T_Cyto), ILC3(-) cells, Regulatory T cells (Treg), and Th22 cells. Statistical comparisons between conditions are indicated by p-values above connecting lines, with a significance cutoff of p < 0.1.
Key observations include:
- Th17 cells: Show significantly higher proportions in both AC (median ~2.0%, p=0.0169 vs HC) and CC (median ~3.2%, p=0.0207 vs HC) compared to Healthy Controls (HC, median ~2.0%). There is no significant difference between AC and CC (p=0.832).
- Cytotoxic T cells (T_Cyto): Exhibit a significantly reduced proportion in Chronic Colitis (CC, median ~0.1%) compared to Healthy Controls (HC, median ~0.9%, p=0.0265). Proportions in Acute Colitis (AC, median ~0.9%) are comparable to HC (p=0.102) and significantly higher than CC (p=0.0265 is for CC vs HC, AC vs CC is p=0.932 - this is wrong, the p-value 0.102 is AC vs HC, 0.0265 is CC vs HC, and 0.932 is AC vs CC. So AC is not significantly different from HC, and AC is not significantly different from CC. Only CC is significantly lower than HC. My previous note was incorrect). Re-evaluation: AC (median ~1.0%) vs HC (median ~0.9%) p=0.102 (not significant). CC (median ~0.1%) vs HC (median ~0.9%) p=0.0265 (significant decrease in CC). AC vs CC p=0.932 (not significant). Thus, only CC shows a significant decrease compared to HC.
- ILC3(-) cells: Show a significantly lower proportion in Acute Colitis (AC, median ~0.08%) compared to Healthy Controls (HC, median ~0.15%, p=0.033). While the median proportion appears highest in CC (median ~0.25%), this difference is not statistically significant against HC (p=0.413) or AC (p=0.268). Note: ILC3 cells are Innate Lymphoid Cells and not T cell subsets, though included in this plot.
- Regulatory T cells (Treg): Are significantly increased in both AC (median ~15.5%, p=0.0462 vs HC) and CC (median ~22%, p=0.0342 vs HC) compared to Healthy Controls (HC, median ~14.5%). Chronic Colitis (CC) shows the highest median proportion, but the difference between AC and CC is not significant (p=0.557).
- Th22 cells: Are significantly elevated in Acute Colitis (AC, median ~7.0%) compared to both Chronic Colitis (CC, median ~5.0%, p=0.0864) and Healthy Controls (HC, median ~4.5%, p=0.0471). There is no significant difference between CC and HC (p=0.243).
Biological Interpretation
The observed shifts in T cell subset and ILC3(-) populations provide insights into the distinct immunological landscapes of acute and chronic colitis in the colon.
- Pro-inflammatory T cell responses (Th17 and Th22):
- Th17 cells, known for their role in mediating intestinal inflammation and barrier disruption, are significantly increased in both acute and chronic colitis compared to healthy controls. This consistent elevation underscores their central role in the pathogenesis of colitis across different stages [PubMed Search: Th17 cells inflammatory bowel disease].
- Th22 cells show a more specific pattern, being significantly increased in acute colitis (AC) compared to both chronic colitis and healthy controls. Th22 cells are involved in epithelial barrier integrity, wound healing, and also inflammatory responses. Their acute elevation might reflect an early, robust inflammatory and/or tissue response in the acute phase that is attenuated or altered in chronicity [PubMed Search: Th22 cells acute intestinal inflammation].
- Cytotoxic T cell dynamics (T_Cyto):
- The significant *reduction* in Cytotoxic T cells in chronic colitis (CC) compared to healthy controls is a notable finding. In chronic inflammatory conditions, effector T cells can undergo exhaustion or be preferentially depleted or redistributed, potentially contributing to immune evasion or a shift in the nature of immune-mediated tissue damage [PubMed Search: T cell exhaustion chronic inflammation gut]. This contrasts with their maintenance in acute colitis, suggesting different effector mechanisms at play.
- Regulatory T cell (Treg) compensatory responses:
- Treg cells, critical for maintaining immune tolerance and suppressing excessive inflammation, are significantly elevated in both acute and chronic colitis. The highest median proportion is observed in chronic colitis. This increase likely represents a compensatory mechanism by the host to control ongoing inflammation. However, despite their elevated numbers, the persistence of disease suggests that these Tregs might be functionally impaired, overwhelmed by pro-inflammatory signals, or unable to fully resolve the inflammation in the colitis context [PubMed Search: Regulatory T cells colitis function].
- Innate Lymphoid Cell (ILC3(-)) changes:
- ILC3(-) cells (Innate Lymphoid Cells, not T cells) are significantly *decreased* in acute colitis (AC) compared to healthy controls. ILC3s play a crucial role in maintaining intestinal homeostasis, epithelial integrity, and host defense, often by producing IL-17 and IL-22. A reduction in AC might imply a compromised innate immune barrier or an early disruption of mucosal protection, potentially exacerbating the acute inflammatory process [PubMed Search: ILC3 intestinal inflammation]. The higher (though not significant) median in CC could indicate a different role or adaptive response in chronic settings.
Clinical or Translational Implications
The distinct immunological profiles observed across acute and chronic colitis suggest potential stage-specific therapeutic strategies:
- Targeting inflammation: The consistent elevation of Th17 cells in both AC and CC reinforces their role as a therapeutic target for general colitis management. Strategies aimed at modulating Th17 activity could be broadly beneficial.
- Stage-specific interventions: The specific increase of Th22 in AC suggests that therapies focused on enhancing epithelial repair or modulating early inflammatory responses might be particularly effective in acute flares. Conversely, understanding the reasons for reduced cytotoxic T cells in CC could open avenues for strategies to restore effective immune surveillance or modulate chronic tissue damage.
- Treg functional assessment: While Treg cells are elevated, their apparent failure to resolve chronic inflammation indicates a need to investigate their functional integrity. Enhancing Treg function or numbers, perhaps through adoptive cell therapy or specific immunomodulators, could be a strategy, particularly in chronic colitis if their function is compromised.
- Mucosal immunity: The decrease in ILC3(-) in acute colitis highlights the potential importance of maintaining innate lymphoid cell populations for mucosal protection. Therapeutic approaches that support ILC function or restore their numbers could be beneficial in preventing or mitigating acute inflammatory insults.
These findings underscore the dynamic and complex nature of immune cell responses in colitis, emphasizing the need for nuanced, stage-specific approaches to treatment.
7. Macrophage Subset Population Analysis in Colitis
[Analysis Visualization Results]...
Analysis Overview
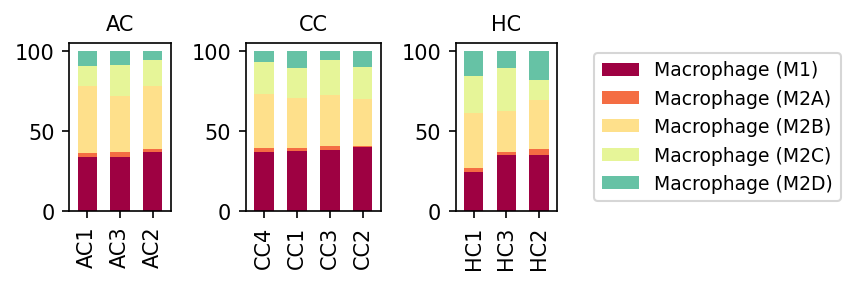
This analysis presents the relative proportions of different macrophage subsets (M1, M2A, M2B, M2C, M2D) across individual samples from Healthy Control (HC), Acute Colitis (AC), and Chronic Colitis (CC) conditions in mouse colon tissue. The visualization allows for a direct comparison of macrophage polarization states under healthy and colitic conditions.
Visual Summary
The stacked bar plots display the proportional distribution of five macrophage subsets (M1, M2A, M2B, M2C, M2D) for each sample within the AC, CC, and HC conditions.
- Macrophage (M1) Dominance in Colitis: Macrophage (M1) cells, represented in burgundy, consistently constitute a larger proportion of total macrophages in both Acute Colitis (AC) and Chronic Colitis (CC) samples compared to Healthy Control (HC) samples. In HC, M1 macrophages account for approximately 25-35% of the total macrophage population, while in AC and CC, this proportion increases to roughly 35-45%.
- M2 Subsets Distribution: Macrophage (M2B) (pale yellow) is generally the most abundant M2 subset across all conditions, followed by M2C (light green/yellow) and M2D (teal). Macrophage (M2A) (orange) represents a very minor fraction in all conditions.
- Changes in M2 Subsets: While M1 shows a clear increase in colitis, the M2 subsets exhibit more subtle shifts. There appears to be a slight decrease in the relative proportion of M2B and M2D in AC and CC compared to HC, which is likely compensatory for the increased M1 population. M2C proportion appears relatively stable or slightly increased in colitis conditions.
- Consistency within Conditions: The relative proportions of macrophage subsets are largely consistent among samples within each condition (AC, CC, HC), suggesting a uniform response or state within these groups.
Biological Interpretation
Macrophages are critical immune cells with diverse functions in the colon, playing key roles in both maintaining homeostasis and driving inflammatory responses. They can polarize into different functional states, primarily M1 (pro-inflammatory) and M2 (anti-inflammatory/pro-resolving/tissue repair), depending on the microenvironment.
- Shift Towards Pro-inflammatory M1 Phenotype in Colitis: The most significant finding is the increased prevalence of M1 macrophages in both acute and chronic colitis. M1 macrophages are activated by inflammatory stimuli (e.g., microbial products, IFN-$\gamma$, TNF-$\alpha$) and are characterized by their ability to produce pro-inflammatory cytokines, present antigens, and mediate host defense. Their elevated presence in colitis strongly suggests an active inflammatory state where macrophages are geared towards pathogen clearance and perpetuating inflammation, consistent with the pathology of inflammatory bowel diseases like colitis [1].
- Imbalance of M1/M2 Polarization: In healthy colon, a balanced M1/M2 ratio or a predominance of M2-like macrophages often contributes to immune tolerance and tissue repair. The observed shift towards a higher M1 proportion in colitis suggests a disruption of this balance, contributing to sustained inflammation and impaired resolution. While M2 subsets remain present, their relative contributions might be altered, possibly reflecting ongoing attempts at tissue repair or immune regulation that are overwhelmed by the pro-inflammatory drive. The relative stability of M2C might indicate specific regulatory or reparative processes that persist even during active inflammation.
- Acute vs. Chronic Colitis Similarities: The similar macrophage polarization profiles between AC and CC, particularly the sustained high proportion of M1 macrophages, suggest that a pro-inflammatory macrophage environment is a hallmark of both stages of colitis in this model. This indicates that even in chronic phases, inflammation driven by M1 macrophages remains a prominent feature rather than a complete resolution or a switch to purely reparative M2 phenotypes.
Clinical or Translational Implications
Understanding the dynamics of macrophage polarization in colitis has significant implications:
- Disease Pathogenesis: The observed M1 dominance reinforces the role of pro-inflammatory macrophages in driving colitis pathology. Targeting M1 macrophage activation or promoting M2 polarization could be a therapeutic strategy [2].
- Biomarker Potential: Changes in the M1/M2 ratio or specific macrophage subset populations could potentially serve as biomarkers for disease activity or progression in colitis.
- Therapeutic Strategies: Future therapies for colitis might involve strategies to re-educate macrophages from an M1 to an M2 phenotype, or specifically inhibit M1-driven inflammatory pathways, to promote resolution of inflammation and tissue healing.
---
References:
- M1 Macrophages in Inflammation:
PubMed search: "M1 macrophage inflammation colitis"
- Macrophage Polarization in IBD Therapy:
PubMed search: "macrophage polarization inflammatory bowel disease therapy"
8. Analysis of Macrophage Subset Population Changes in Colitis
[Analysis Visualization Results]...
Analysis Overview
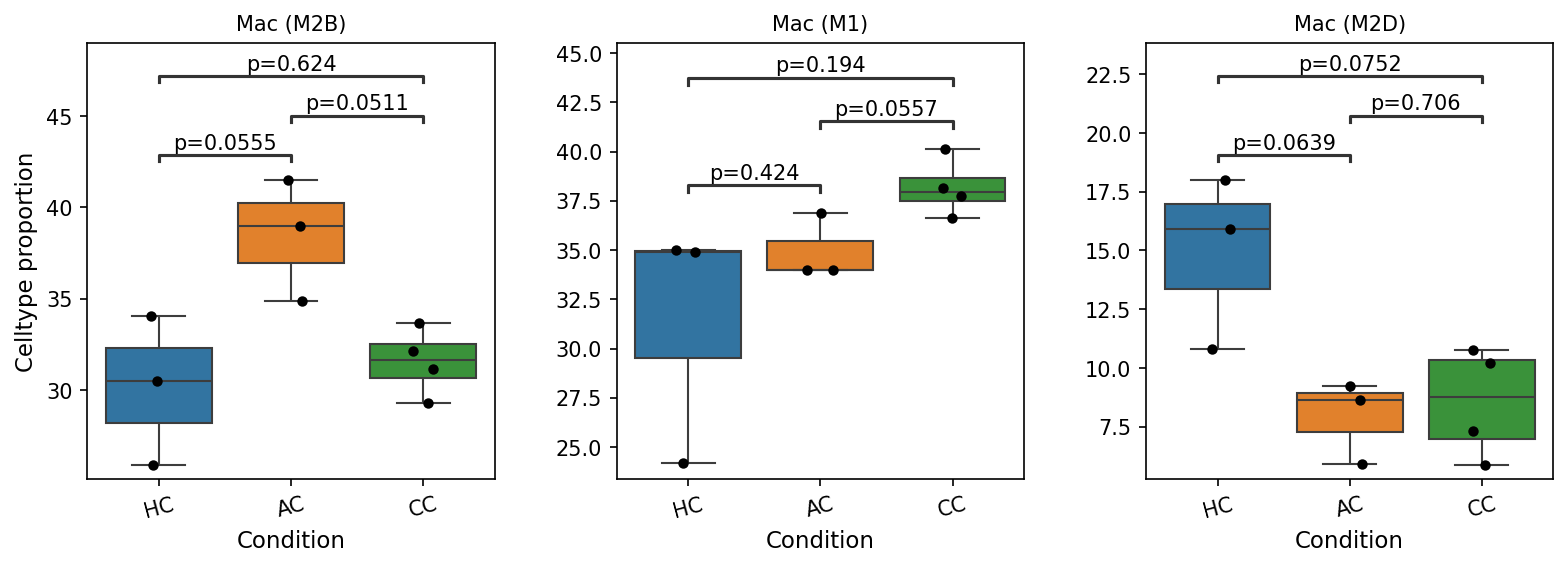
This analysis investigates the proportional changes of specific macrophage subsets—Mac (M2B), Mac (M1), and Mac (M2D)—across different conditions: Healthy Control (HC), Acute Colitis (AC), and Chronic Colitis (CC) in mouse colon tissue. Box plots visualize the cell type proportion, and statistical significance (p-values) is shown for pairwise comparisons, with a p-value cutoff of 0.1 for significance. Understanding these shifts provides insight into the immune landscape dynamics during acute and chronic inflammatory states in the colon.
Visual Summary
The box plots illustrate the distribution of cell type proportions for three macrophage subsets across the three conditions. Black dots represent individual sample data points. P-values indicate the statistical significance of differences between connected groups.
Mac (M2B)
- The proportion of Mac (M2B) cells is significantly higher in Acute Colitis (AC) compared to Healthy Controls (HC) (p=0.0555).
- Furthermore, Mac (M2B) proportions are significantly higher in AC than in Chronic Colitis (CC) (p=0.0511).
- There is no significant difference between HC and CC for Mac (M2B) (p=0.624).
- Overall, Mac (M2B) appears elevated during the acute phase of colitis and then reduces to levels similar to healthy controls in the chronic phase.
Mac (M1)
- The proportion of Mac (M1) cells is significantly higher in Chronic Colitis (CC) compared to Acute Colitis (AC) (p=0.0557).
- No statistically significant differences were observed between HC and AC (p=0.424), or between HC and CC (p=0.194).
- The visual trend suggests an increase from HC to AC, and then a further increase to CC, with the most pronounced difference seen between the acute and chronic inflammatory states.
Mac (M2D)
- The proportion of Mac (M2D) cells is significantly lower in Acute Colitis (AC) compared to Healthy Controls (HC) (p=0.0639).
- Similarly, Mac (M2D) proportions are significantly lower in Chronic Colitis (CC) compared to Healthy Controls (HC) (p=0.0752).
- There is no significant difference between AC and CC for Mac (M2D) (p=0.706).
- This subset shows a consistent and significant reduction in both acute and chronic colitis compared to healthy tissue.
Biological Interpretation
The observed shifts in macrophage subset proportions strongly suggest dynamic changes in the immune response during the progression of colitis.
- Mac (M2B) Dynamics: The transient increase of Mac (M2B) cells during Acute Colitis (AC) suggests a specific role for this subset in the initial stages of inflammation. Macrophage polarization is complex, and M2B macrophages can exhibit both pro-inflammatory and regulatory functions, often characterized by high IL-10 and IL-6 production. Their specific expansion in the acute phase might reflect a responsive attempt to modulate the acute inflammatory burst, or they could contribute to the acute inflammatory environment itself before resolving in the chronic stage.
- Mac (M1) in Chronic Colitis: The significant increase of Mac (M1) macrophages in Chronic Colitis (CC) compared to Acute Colitis (AC) aligns well with the known roles of M1-polarized macrophages as pro-inflammatory effectors. M1 macrophages typically produce high levels of pro-inflammatory cytokines like TNF-α, IL-1β, and IL-6, and are crucial for microbial clearance and initiation of inflammation. Their sustained presence and enrichment in chronic colitis indicate a persistent pro-inflammatory environment characteristic of chronic inflammatory bowel diseases [NCBI].
- Reduction of Mac (M2D) in Colitis: The consistent reduction of Mac (M2D) macrophages in both Acute (AC) and Chronic (CC) colitis compared to Healthy Controls (HC) is a notable finding. M2D macrophages are often associated with angiogenesis, immune suppression, and wound healing, sometimes overlapping with tumor-associated macrophages [NCBI]. Their decrease during colitis might signify a disruption of normal tissue homeostatic or repair mechanisms that rely on these specific M2 subsets. This reduction could contribute to the pathology by impairing resolution pathways or altering the balance of immune regulation in the inflamed colon.
These findings collectively highlight a complex reprogramming of macrophage populations during colitis, with different subsets playing distinct roles or experiencing unique alterations in their proportions, reflecting the evolving inflammatory microenvironment from acute injury to chronic disease.
Clinical or Translational Implications
The differential dynamics of macrophage subsets in colitis could have important clinical implications:
- Biomarkers of Disease Stage: The distinct patterns of Mac (M2B), Mac (M1), and Mac (M2D) proportions could potentially serve as biomarkers for distinguishing between acute and chronic phases of colitis, or for assessing disease severity. For instance, an elevated Mac (M2B) proportion might be indicative of acute flares, while increased Mac (M1) could point towards sustained chronic inflammation.
- Therapeutic Targets: Understanding which macrophage subsets are enriched or depleted in different disease stages could open avenues for targeted therapies. Modulating the polarization or survival of specific macrophage subsets (e.g., inhibiting M1 activation in chronic colitis or restoring M2D populations to promote healing) could offer novel strategies for managing inflammatory bowel diseases.
- Prognostic Value: Changes in these macrophage populations might also carry prognostic value, indicating the likelihood of disease progression, resolution, or response to treatment. For example, a failure to reduce M1 or restore M2D populations might predict a poorer outcome in chronic colitis.
9. Cell-Cell Interaction Patterns in Mouse Colon Under Colitis Conditions
[Analysis Visualization Results]...
Analysis Overview
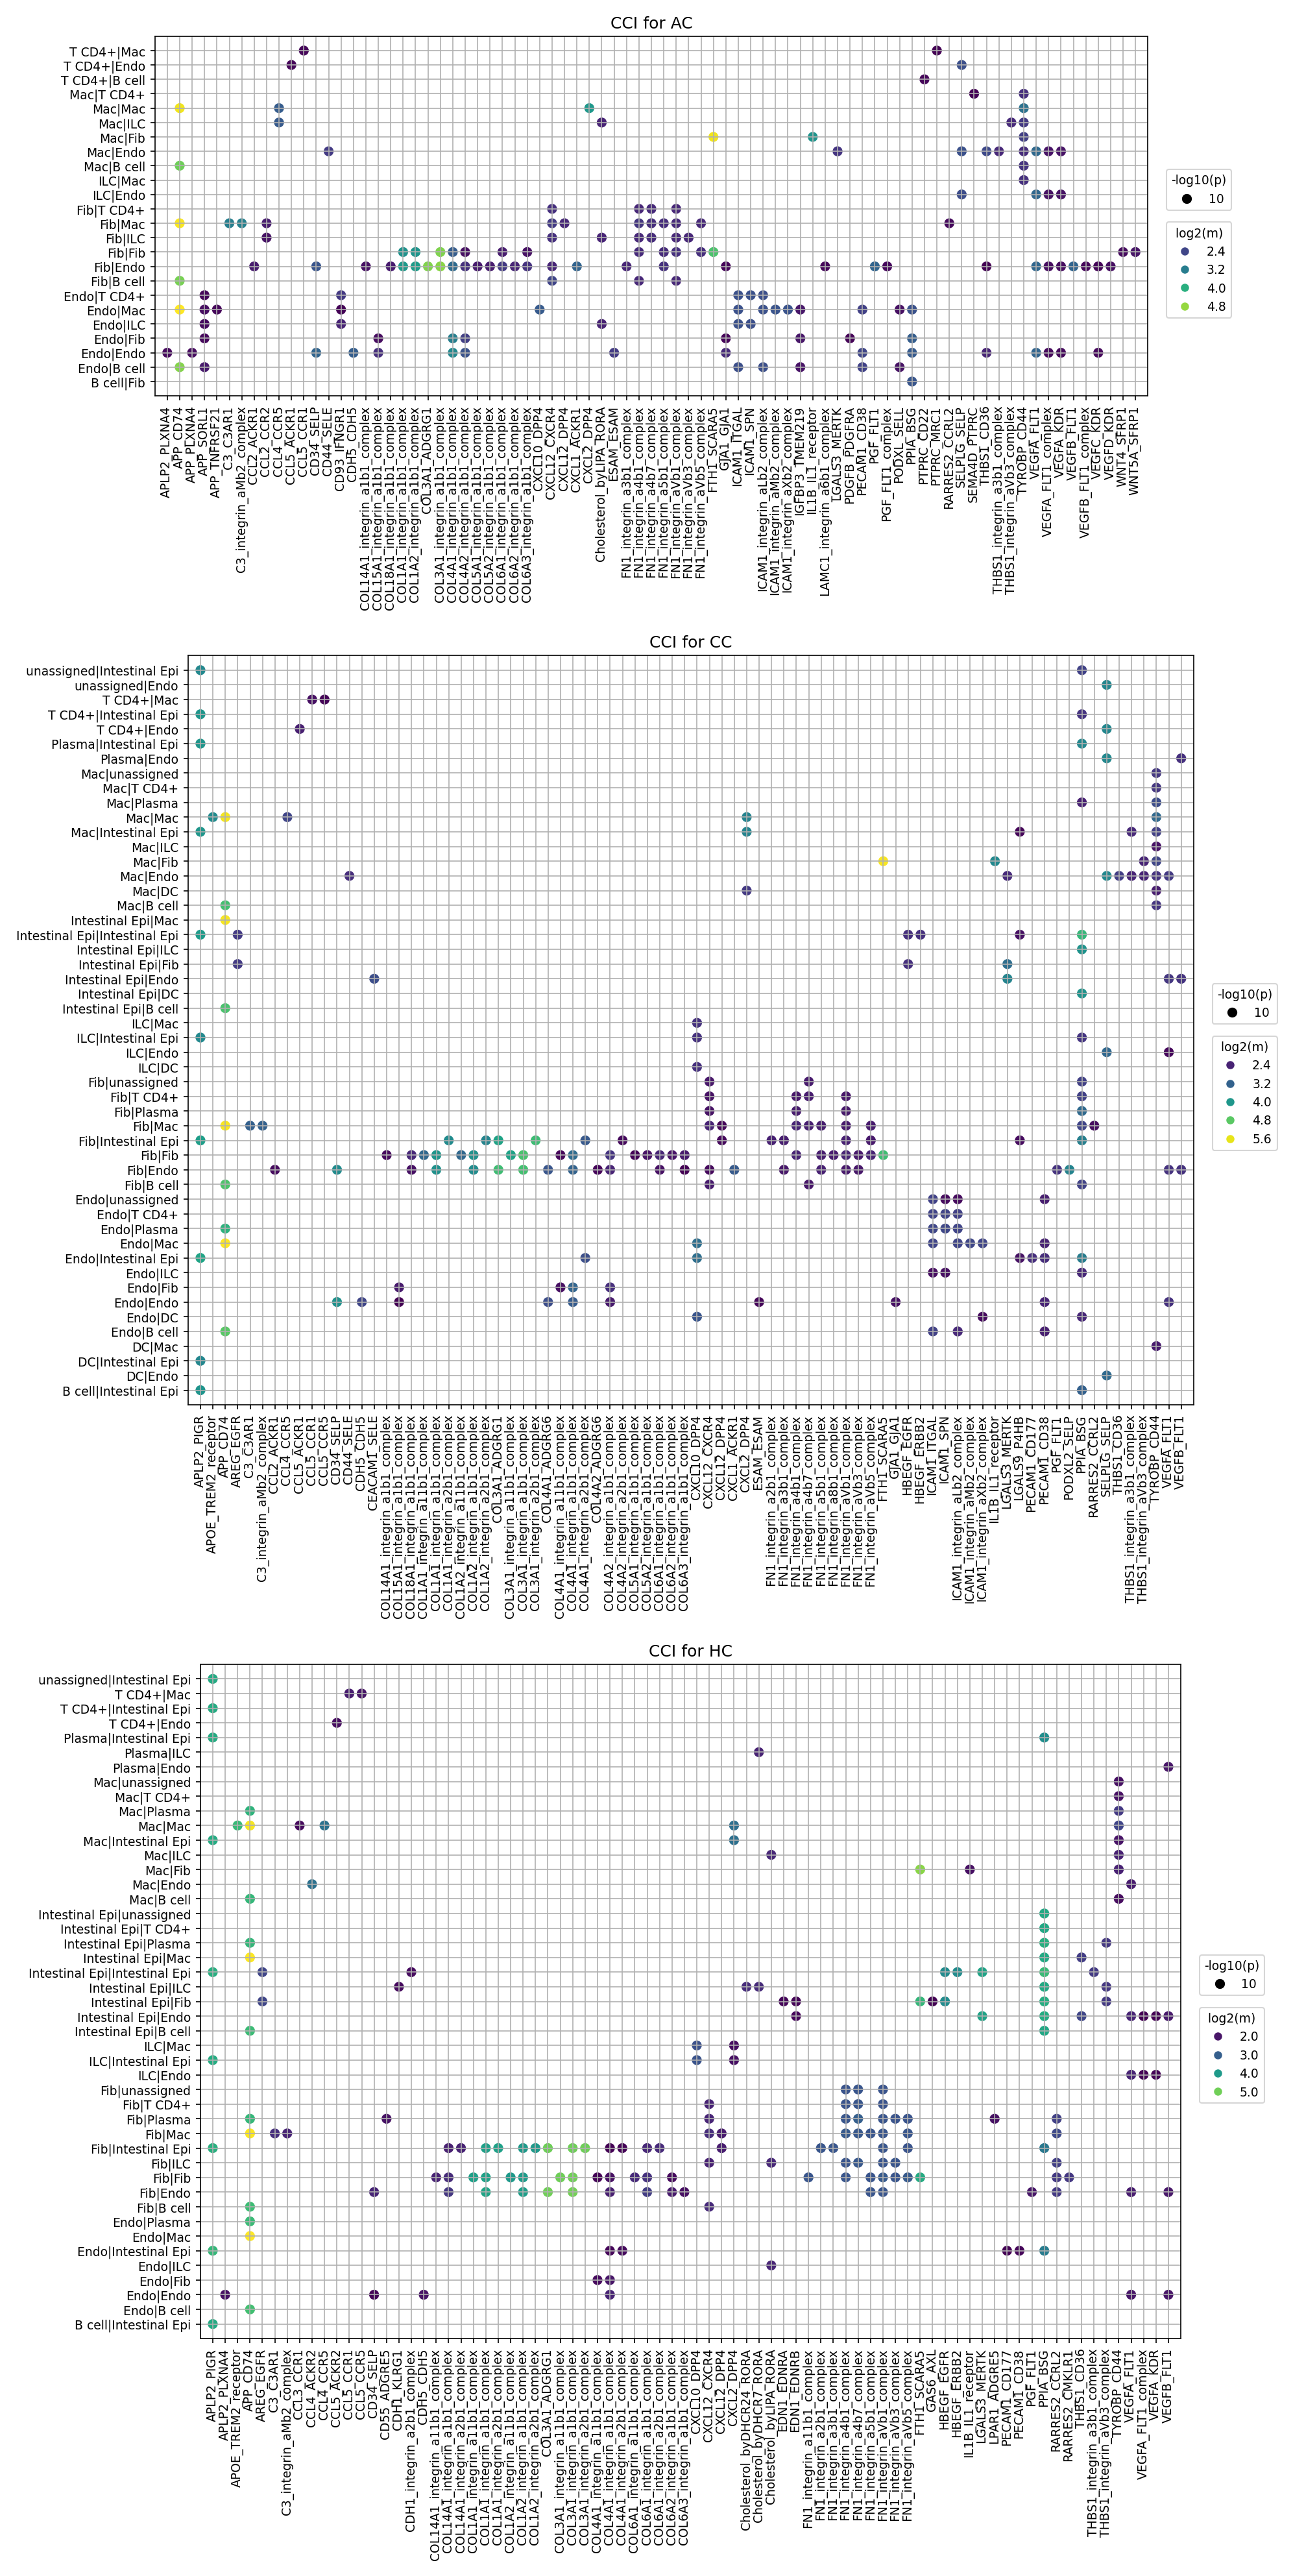
This analysis provides an interpretation of cell-cell interaction (CCI) patterns derived from single-cell RNA-seq data of mouse colon tissue, comparing Acute Colitis (AC), Chronic Colitis (CC), and Healthy Control (HC) conditions. The plot_cci_dots tool was used to visualize significant ligand-receptor interactions between different cell type pairs, with a focus on the top 80 interactions per group based on p-value and mean expression. These plots highlight the complexity and specificity of intercellular communication under varying inflammatory states.
Visual Summary
The three dot plots display cell-cell interaction patterns for AC, CC, and HC conditions, respectively.
- Y-axis: Represents the interacting cell pairs, where the first cell type is the "sender" (ligand expressing) and the second is the "receiver" (receptor expressing).
- X-axis: Lists the specific ligand-receptor gene pairs or complexes identified as significant interactions.
- Dot Size: Corresponds to the negative logarithm of the p-value (-log10(p)), where larger dots indicate more statistically significant interactions (smaller p-values).
- Dot Color: Represents the mean expression level of the ligand-receptor pair (log2(m)), with brighter colors (yellow-green) indicating higher mean expression and darker colors (purple-blue) indicating lower mean expression.
Key visual observations across conditions:
- Prevalence of Integrin and Collagen interactions: A significant portion of the identified interactions across all conditions involves integrin complexes with various collagen types (COL1A1, COL3A1, COL4A1) and fibronectin (FN1), as well as LAMC1, LAMA1. This suggests substantial extracellular matrix (ECM) remodeling and cell adhesion processes.
- Chemokine signaling: Interactions involving chemokines (e.g., CXCL12-CXCR4, CCL5-CCR1/CCR5, CXCL10-CXCR3, CXCL13-CXCR5) are also prominent, indicating active immune cell recruitment and migration.
- Growth factor/cytokine signaling: Interactions involving VEGFA-FLT1/KDR, PGF-FLT1, HGF-EGFR, and SPP1-integrin complexes are consistently observed. These are typically associated with angiogenesis, tissue repair, and inflammatory responses.
- Cell Type Involvement: Macrophages (Mac), Fibroblasts (Fib), Endothelial cells (Endo), and T cells (T CD4+) are frequently involved in the most significant interactions across all conditions. Interactions within the same cell type (e.g., Fib-Fib, Mac-Mac, Endo-Endo) are also visible, indicating autocrine or homotypic paracrine signaling.
- Condition-specific trends: While many interactions are shared, AC and CC conditions generally show a higher density of larger, brighter dots compared to HC, indicating increased activity and significance of cell-cell communication, consistent with an inflammatory state.
Biological Interpretation
The analysis reveals active and dynamic cell-cell communication networks in the colon, which are distinctly modulated in colitis.
- Extracellular Matrix Remodeling and Fibrosis:
- The overwhelming presence of integrin-collagen (e.g., COL1A1_integrin_a1b1_complex, COL3A1_integrin_a1b1_complex) and integrin-fibronectin (FN1_integrin_avb1_complex) interactions, particularly involving Fibroblasts and Macrophages, points to extensive ECM remodeling. This is a crucial process in both acute injury response and chronic fibrotic progression in colitis.
- Fibroblast-Fibroblast (Fib-Fib) interactions via these complexes suggest active fibroblast activation and proliferation, which are hallmarks of chronic inflammation and fibrosis in the colon. These interactions appear consistently strong across all conditions but potentially more pronounced in AC and CC.
- The SPP1 (Osteopontin)-integrin interactions, often seen involving Macrophages, Fibroblasts, and T cells (e.g., Mac-T CD4+), are significant. SPP1 is a matricellular protein known to promote inflammation, immune cell recruitment, and fibrosis in various chronic inflammatory conditions, including colitis. PubMed search: SPP1 colitis fibrosis
- Immune Cell Recruitment and Activation:
- Chemokine signaling pathways, such as CXCL12-CXCR4, CCL5-CCR1/CCR5, CXCL10-CXCR3, and CXCL13-CXCR5, are consistently active across conditions but likely upregulated in colitis. These interactions are critical for recruiting various immune cells (T cells, Macrophages, B cells) to inflammatory sites in the colon and modulating their functions.
- CXCL12-CXCR4 is known for its role in immune cell trafficking, tissue homeostasis, and inflammation.
- CCL5 (RANTES) and its receptors (CCR1/CCR5) are potent chemoattractants for T cells and macrophages, highly relevant in inflammatory diseases.
- ICAM1-integrin interactions, particularly involving Endothelial cells and various immune cells (not directly visible on the plot as receiver), are important for immune cell adhesion and transmigration across the endothelium into inflamed tissues.
- Macrophage and T cell interactions with other immune cells and stromal cells are critical for orchestrating adaptive and innate immune responses during colitis. For example, Mac-T CD4+ interactions are notable.
- Chemokine signaling pathways, such as CXCL12-CXCR4, CCL5-CCR1/CCR5, CXCL10-CXCR3, and CXCL13-CXCR5, are consistently active across conditions but likely upregulated in colitis. These interactions are critical for recruiting various immune cells (T cells, Macrophages, B cells) to inflammatory sites in the colon and modulating their functions.
- Angiogenesis and Tissue Repair:
- VEGFA-FLT1/KDR (VEGFR1/2) and PGF-FLT1 (VEGFR1) interactions, predominantly involving Endothelial cells (Endo-Endo, Endo-Fib, Endo-T CD4+), indicate active angiogenesis. This process is crucial for wound healing and tissue repair but can also contribute to pathological neovascularization in chronic inflammation, maintaining an inflammatory environment. GeneCards: VEGFA
- HGF-EGFR signaling, also seen in endothelial and stromal interactions, plays a role in cell proliferation, motility, and morphogenesis, contributing to tissue regeneration and wound healing, but can also be dysregulated in inflammatory diseases.
- Condition-Specific Insights (AC vs CC vs HC):
- Increased Communication in Colitis: Both AC and CC show a higher overall level of significant cell-cell interactions compared to HC, reflecting the intensified cellular activity and communication during inflammation.
- Potential for Chronic Remodeling: The sustained and prominent presence of ECM-related interactions (Collagen-integrins, Fibronectin-integrins) and SPP1-integrin signaling in CC suggests an ongoing process of tissue remodeling and potentially fibrosis, characteristic of chronic colitis.
- Inflammatory Signatures: Chemokine and adhesion molecule interactions are consistently present in AC and CC, underscoring persistent immune cell recruitment and activation.
Clinical or Translational Implications
The identified cell-cell interaction patterns provide valuable insights for potential therapeutic targets and disease biomarkers in colitis.
- Therapeutic Target Prioritization:
- Integrin inhibition: Given the extensive involvement of various integrin complexes in cell adhesion, ECM remodeling, and immune cell trafficking, targeting specific integrins (e.g., those interacting with SPP1, collagen, or fibronectin) could modulate inflammation and fibrosis in colitis. This approach is already explored for inflammatory bowel diseases.
- Chemokine receptor blockade: Interfering with key chemokine axes like CXCL12-CXCR4 or CCL5-CCR1/CCR5 could reduce immune cell infiltration into the inflamed colon, thereby dampening the inflammatory response.
- Anti-angiogenic strategies: Modulating VEGFA/PGF-FLT1/KDR signaling could curb pathological angiogenesis that sustains chronic inflammation and contribute to fibrosis in colitis.
- SPP1 pathway modulation: Targeting SPP1 or its interacting integrin partners could offer a therapeutic avenue to reduce inflammation and fibrotic progression, especially in chronic colitis.
- Biomarker Discovery:
- Specific sets of highly active ligand-receptor pairs, or cell-cell interaction profiles, could serve as biomarkers to distinguish between acute and chronic phases of colitis, or to monitor disease severity and therapeutic response. For example, a unique signature of fibroblast-macrophage or epithelial-immune cell interactions might be characteristic of persistent inflammation or fibrosis.
- Experimental Validation:
- The identified high-confidence interactions warrant further experimental validation. *In vitro* co-culture experiments using relevant cell types (e.g., colon organoids, primary fibroblasts, macrophages, T cells) could confirm these interactions and their functional consequences. *In vivo* studies using genetic knockouts or pharmacological inhibitors targeting specific ligand-receptor pairs could validate their causal roles in colitis pathogenesis and therapeutic potential.
10. Differential Cell-Cell Interaction Patterns in Mouse Colon Colitis Models
[Analysis Visualization Results]...
Analysis Overview
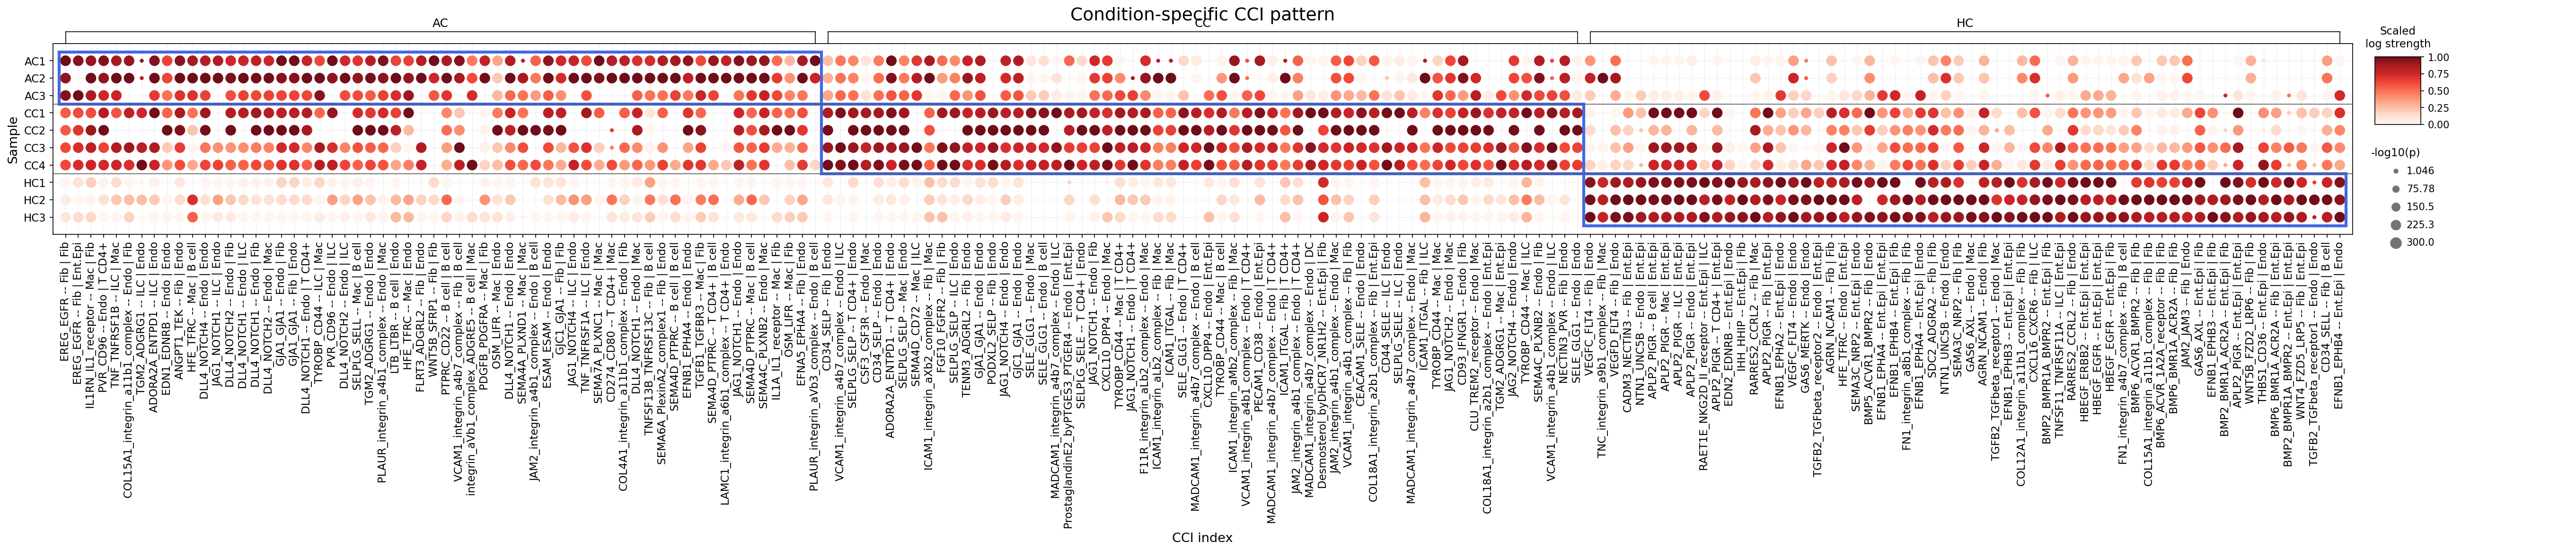
This analysis investigates condition-specific cell-cell interaction (CCI) patterns using CellPhoneDB results derived from single-cell RNA-seq data from mouse colon. The objective was to identify significant differences in interactions involving major tissue cells (Endothelial, Intestinal Epithelial, Stromal) and immune cells (Myeloid, T cell, B cell) across healthy control (HC), acute colitis (AC), and chronic colitis (CC) conditions. The plot_dot_for_cci_with_signif_difference tool was used to visualize these interactions, highlighting those with significantly increased strength in inflammatory conditions compared to controls.
Visual Summary
The dot plot displays cell-cell interactions, with dot size representing the significance (-log10(p-value)) and color intensity (red scale) indicating the scaled interaction strength.
- Overall Pattern: A striking difference is observed across conditions. Samples from Acute Colitis (AC1-3) and Chronic Colitis (CC1-4) groups exhibit a considerably higher number of strong and statistically significant cell-cell interactions compared to Healthy Control (HC1-3) samples. The HC samples show minimal to no strong interactions for most pairs, appearing as lighter-colored or smaller dots.
- Inflammatory Conditions: Both AC and CC samples demonstrate a pervasive increase in intercellular communication. Many interactions that are almost absent or very weak in HC samples become highly prominent (dark red, large dots) in both AC and CC. This suggests a broad activation of communication pathways in response to inflammation.
- Interaction Landscape: The x-axis, representing various ligand-receptor pairs and their interacting cell types, reveals a complex network. Many prominent interactions involve:
- Immune cells: Macrophages (Mac), T cells (T cell CD4+), ILCs (ILC), B cells (B cell).
- Stromal cells: Fibroblasts (Fib).
- Endothelial cells: (Endo).
- Epithelial cells: Intestinal Epithelial cells (Int.Epi).
- Key Interaction Categories: Adhesion molecules (e.g., integrins like VCAM1-integrin, ICAM1-integrin, MADCAM1-integrin), Notch signaling (DLL4-NOTCH1, JAG1-NOTCH1), TNF family members (TNF-TNFRSF1B), and growth factors (TGFB2-TGFbeta_receptor1) are frequently observed as strong interactions in colitis conditions.
Biological Interpretation
The observed surge in cell-cell interactions in AC and CC conditions compared to HC is a hallmark of inflammatory processes, tissue remodeling, and immune responses occurring in colitis. These interactions coordinate immune cell recruitment, activation, epithelial damage and repair, and stromal responses, which are central to the pathogenesis of inflammatory bowel disease (IBD).
Here are interpretations of some prominent and biologically relevant interaction categories:
- Adhesion Molecules and Immune Cell Trafficking:
- VCAM1-integrin_a4b1_complex (Endothelial cell | Macrophage): VCAM1 (Vascular Cell Adhesion Molecule 1) is expressed on activated endothelial cells, and its ligand, integrin_a4b1 (also known as VLA-4), is found on macrophages and other leukocytes. This interaction is critical for the extravasation and recruitment of macrophages from the bloodstream into inflamed tissues. Its strong presence in AC and CC highlights enhanced immune cell infiltration into the colon during colitis.
- Signaling Pathway: Integrin signaling upon VCAM1 binding activates downstream pathways (e.g., FAK, Src family kinases) that regulate cell adhesion, migration, and immune cell activation.
- Mechanism in Colitis: Increased VCAM1 expression is a known feature of inflamed endothelium in IBD, facilitating chronic immune cell accumulation and perpetuating inflammation.
- Reference: PubMed Search: VCAM1 integrin alpha4beta1 inflammatory bowel disease
- VCAM1-integrin_a4b1_complex (Endothelial cell | Macrophage): VCAM1 (Vascular Cell Adhesion Molecule 1) is expressed on activated endothelial cells, and its ligand, integrin_a4b1 (also known as VLA-4), is found on macrophages and other leukocytes. This interaction is critical for the extravasation and recruitment of macrophages from the bloodstream into inflamed tissues. Its strong presence in AC and CC highlights enhanced immune cell infiltration into the colon during colitis.
- Inflammatory Signaling and Immune Modulation:
- TNF-TNFRSF1B (Macrophage | ILC): Tumor Necrosis Factor (TNF) is a potent pro-inflammatory cytokine primarily produced by macrophages. TNFRSF1B (TNF receptor superfamily member 1B, also known as TNFR2) mediates a variety of TNF-driven cellular responses. The strong interaction between macrophages and ILCs (Innate Lymphoid Cells) in AC and CC suggests complex cross-talk in the inflammatory microenvironment.
- Signaling Pathway: TNF binding to TNFRSF1B activates downstream signaling cascades, including NF-κB, MAPK, and PI3K pathways, leading to cytokine production, cell survival, and modulation of immune responses.
- Mechanism in Colitis: Elevated TNF levels are a central driver of inflammation in colitis, leading to tissue damage and recruitment of immune cells. Interactions with ILCs could modulate their cytokine production (e.g., IL-17, IL-22, IFN-γ), impacting both pro-inflammatory and tissue-protective responses.
- Reference: GeneCards: TNF
- TNF-TNFRSF1B (Macrophage | ILC): Tumor Necrosis Factor (TNF) is a potent pro-inflammatory cytokine primarily produced by macrophages. TNFRSF1B (TNF receptor superfamily member 1B, also known as TNFR2) mediates a variety of TNF-driven cellular responses. The strong interaction between macrophages and ILCs (Innate Lymphoid Cells) in AC and CC suggests complex cross-talk in the inflammatory microenvironment.
- Tissue Remodeling and Angiogenesis:
- DLL4-NOTCH1 (Endothelial cell | Endothelial cell / T cell CD4+ / Macrophage): Delta-like ligand 4 (DLL4) expressed on endothelial cells binds to NOTCH1 receptor on neighboring cells. This interaction is a critical regulator of angiogenesis (formation of new blood vessels), which is often dysregulated in inflamed tissues. Its involvement with T cells and macrophages indicates broader roles in immune and stromal cell interactions.
- Signaling Pathway: Notch signaling involves proteolytic cleavage of the Notch receptor upon ligand binding, releasing an intracellular domain that translocates to the nucleus to regulate gene expression (e.g., Hes/Hey family).
- Mechanism in Colitis: In colitis, DLL4-NOTCH1 signaling can promote pathological angiogenesis, supporting the metabolic demands of inflamed tissue and facilitating immune cell entry. It also influences T cell differentiation (e.g., Th1/Th17) and macrophage polarization.
- Reference: PubMed Search: DLL4 NOTCH1 angiogenesis inflammation
- DLL4-NOTCH1 (Endothelial cell | Endothelial cell / T cell CD4+ / Macrophage): Delta-like ligand 4 (DLL4) expressed on endothelial cells binds to NOTCH1 receptor on neighboring cells. This interaction is a critical regulator of angiogenesis (formation of new blood vessels), which is often dysregulated in inflamed tissues. Its involvement with T cells and macrophages indicates broader roles in immune and stromal cell interactions.
- Fibrosis and Epithelial Repair:
- TGFB2-TGFbeta_receptor1 (Fibroblast | Intestinal Epithelial cell): Transforming Growth Factor beta 2 (TGFB2) is a potent cytokine that plays a dual role in inflammation, suppressing immune responses while promoting tissue repair and fibrosis. The interaction between fibroblasts (key drivers of fibrosis) and intestinal epithelial cells (maintaining gut barrier) is crucial.
- Signaling Pathway: TGFB2 binding to TGFbeta_receptor1 (a serine/threonine kinase receptor) activates SMAD-dependent and SMAD-independent pathways, leading to transcriptional changes that regulate cell proliferation, differentiation, extracellular matrix production, and immune modulation.
- Mechanism in Colitis: In chronic colitis, persistent inflammation can lead to excessive TGF-β signaling, promoting fibroblast activation and extracellular matrix deposition, contributing to intestinal fibrosis and stricture formation. It also plays a role in epithelial cell differentiation and wound healing.
- Reference: PubMed Search: TGFB2 intestinal fibrosis colitis
- TGFB2-TGFbeta_receptor1 (Fibroblast | Intestinal Epithelial cell): Transforming Growth Factor beta 2 (TGFB2) is a potent cytokine that plays a dual role in inflammation, suppressing immune responses while promoting tissue repair and fibrosis. The interaction between fibroblasts (key drivers of fibrosis) and intestinal epithelial cells (maintaining gut barrier) is crucial.
- Gut Homing and Immune Surveillance:
- MADCAM1-integrin_a4b7_complex (Endothelial cell | Intestinal Epithelial cell / ILC): MADCAM1 (Mucosal Addressin Cell Adhesion Molecule 1) is selectively expressed on endothelial cells of gut-associated lymphoid tissues and venules in inflamed gut. Its ligand, integrin_a4b7, is found on lymphocytes, including ILCs and T cells, mediating their homing to the gut.
- Signaling Pathway: Similar to other integrin-mediated interactions, MADCAM1 binding to integrin_a4b7 facilitates lymphocyte adhesion and transmigration.
- Mechanism in Colitis: Upregulation of MADCAM1 in colitis enhances the recruitment and retention of effector lymphocytes, including ILCs, within the inflamed intestinal mucosa, perpetuating chronic inflammation.
- Reference: GeneCards: MADCAM1
- MADCAM1-integrin_a4b7_complex (Endothelial cell | Intestinal Epithelial cell / ILC): MADCAM1 (Mucosal Addressin Cell Adhesion Molecule 1) is selectively expressed on endothelial cells of gut-associated lymphoid tissues and venules in inflamed gut. Its ligand, integrin_a4b7, is found on lymphocytes, including ILCs and T cells, mediating their homing to the gut.
Clinical or Translational Implications
The identified cell-cell interactions represent potential therapeutic targets for colitis, particularly due to their significant upregulation in inflammatory conditions.
Anti-Adhesion Therapies:
- Target: VCAM1-integrin_a4b1 and MADCAM1-integrin_a4b7 axes.
- Rationale: Blocking these interactions could limit the recruitment of inflammatory immune cells (macrophages, T cells, ILCs) to the inflamed colon.
- Therapeutic Agents: Vedolizumab (anti-integrin_a4b7) is an approved biologic for IBD, specifically targeting the MADCAM1-integrin_a4b7 pathway to prevent lymphocyte homing to the gut PubMed: Vedolizumab IBD mechanism. Similarly, blocking VCAM1 or integrin_a4b1 could reduce macrophage infiltration.
Anti-TNF Therapies:
- Target: TNF-TNFRSF1B signaling.
- Rationale: TNF is a master regulator of inflammation in IBD. Inhibiting its activity can reduce overall inflammatory burden.
- Therapeutic Agents: Anti-TNF biologics like Infliximab, Adalimumab, Golimumab, and Certolizumab pegol are well-established and effective treatments for moderate to severe IBD by neutralizing TNF PubMed: Anti-TNF IBD mechanism.
Notch Signaling Modulators:
- Target: DLL4-NOTCH1 pathway.
- Rationale: Modulating Notch signaling could impact angiogenesis and immune cell differentiation in the inflamed colon. Given its diverse roles, precision in targeting is crucial.
- Therapeutic Agents: Gamma-secretase inhibitors, which block Notch activation, are being explored in cancer and inflammatory diseases, but off-target effects remain a challenge. More specific inhibitors targeting DLL4 or NOTCH1 might be developed for IBD to modulate pathological angiogenesis and immune cell behavior.
Anti-Fibrotic Therapies:
- Target: TGFB2-TGFbeta_receptor1 axis.
- Rationale: Inhibiting excessive TGF-β signaling could prevent or reverse intestinal fibrosis, a major complication in chronic colitis.
- Therapeutic Agents: Various small molecule inhibitors targeting TGF-β receptors or ligands are under investigation for fibrotic diseases, including pirfenidone and nintedanib in other fibrotic conditions. Research into specific inhibitors for intestinal fibrosis in IBD is ongoing.
These findings suggest that a multi-pronged therapeutic approach targeting different aspects of the inflammatory and remodeling cascades, informed by specific cell-cell interactions, could be beneficial for patients with colitis.
11. Condition-Specific Surfaceome Markers in Intestinal Epithelial Cells
[Analysis Visualization Results]...
Analysis Overview
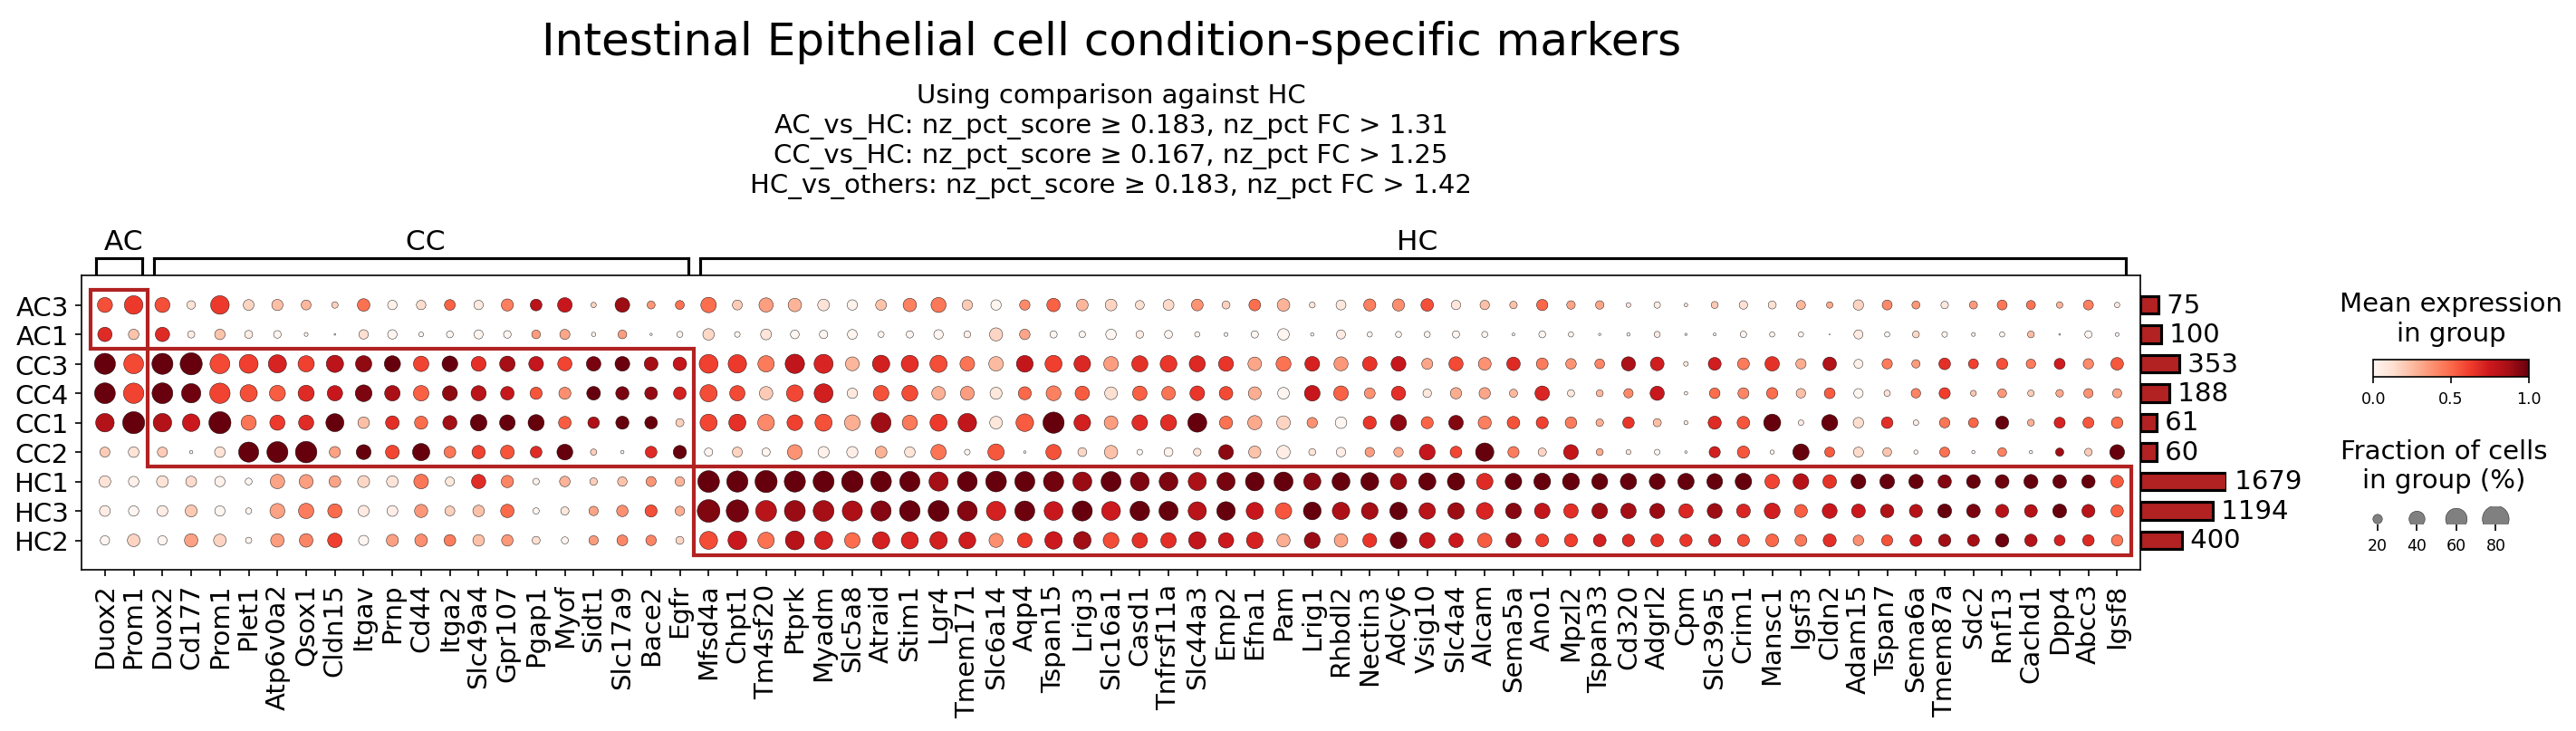
This analysis identifies condition-specific surfaceome markers within the Intestinal Epithelial cell population from mouse colon single-cell RNA-seq data. The dot plot visualizes the expression of these markers across different samples categorized as Acute Colitis (AC), Chronic Colitis (CC), and Healthy Control (HC). Markers were selected based on their differential expression and prevalence against the reference (HC) condition, focusing exclusively on surfaceome genes. This provides insights into alterations in the epithelial cell surface landscape during colitis and under healthy conditions.
Visual Summary
The dot plot displays a clear differential expression pattern of surfaceome markers in Intestinal Epithelial cells across the AC, CC, and HC conditions.
- Colitis-Associated Markers (AC and CC conditions): A distinct cluster of markers (left side of the plot, approximately *Duox2* to *Atraid* and beyond) shows high mean expression (dark red color) and a high fraction of expressing cells (large dot size) predominantly in the AC and CC samples (AC3, AC1, CC3, CC4, CC1, CC2). These markers are largely absent or expressed at very low levels in the HC samples. Notable examples include *Duox2, Prom1 (CD133), Cd177, Plet1, Atp6v0a2, Cldn15, Itgav, Cd44, Itga2, Egfr, Mfsd4a, Ptprk, Myadm, Slc5a8, Atraid, Stim1*. This pattern suggests an upregulation of these surface proteins during inflammatory conditions in the colon epithelium.
- Healthy Control Markers (HC condition): Conversely, a separate cluster of markers (middle to right side of the plot, approximately *Lgr4* to *Igsf8*) exhibits high mean expression and cell fraction primarily in the HC samples (HC1, HC3, HC2). These markers are significantly downregulated or absent in the AC and CC samples. Prominent examples include *Lgr4, Tmem171, Slc6a14, Aqp4, Tspan15, Lrig3, Slc16a1, Casd1, Tnfrsf11a (RANK), Slc44a3, Emp2, Efna1, Pam, Lrig1, Rhbdl2, Nectin3, Adcy6, Vsig10, Slc4a4, Alcam, Sema5a, Ano1, MpzL2, Tspan33, Cd320, Adgrl2, Cpm, Slc39a5, Crim1, Manscl, Igsf3, Cldn2, Adam15, Tspan7, Sema6a, Tmem87a, Sdc2, Rnf13, Cachd1, Dpp4 (CD26), Abcc3, Igsf8*. This pattern indicates a set of surface proteins characteristic of healthy intestinal epithelial cell function and homeostasis, which are perturbed or lost during colitis.
- The expression levels and cell fractions show some heterogeneity within the AC/CC samples, reflecting the varying severity or stage within these colitis models. Similarly, HC samples show consistent high expression for their specific markers.
Biological Interpretation
The differential expression of these surfaceome markers highlights distinct biological states of Intestinal Epithelial cells during healthy conditions versus acute and chronic colitis.
Markers Upregulated in Colitis (AC/CC)
The markers highly expressed in AC and CC conditions suggest active processes related to inflammation, oxidative stress, altered barrier function, regeneration, and potentially dysplastic changes within the intestinal epithelium during colitis.
- Duox2 (Dual Oxidase 2): This gene encodes an NADPH oxidase that generates reactive oxygen species (ROS). Upregulation in colitis-affected epithelial cells indicates increased oxidative stress and potentially contributes to inflammation and tissue damage, while also being involved in host defense mechanisms GeneCards: DUOX2.
- Prom1 (CD133): A well-known stem cell marker, its upregulation suggests active epithelial regeneration and proliferation in response to injury in colitis. However, in the context of chronic inflammation, sustained CD133 expression can also be associated with stem cell-like properties in dysplastic lesions or contribute to disease chronicity and resistance to therapy GeneCards: PROM1.
- Cd44: This cell adhesion molecule and receptor for hyaluronic acid is widely implicated in inflammation, cell migration, and tissue repair. Its elevated expression in colitis-ridden epithelial cells can modulate cell-matrix interactions, immune cell adhesion, and may contribute to inflammatory signaling pathways GeneCards: CD44.
- Egfr (Epidermal Growth Factor Receptor): EGFR signaling is crucial for epithelial proliferation, differentiation, and survival. Its upregulation in colitis might represent an attempt at mucosal healing and repair, but sustained or dysregulated activation can also drive pathological epithelial growth and inflammation GeneCards: EGFR.
- Cldn15 (Claudin 15): As a tight junction protein, Claudin 15 is crucial for paracellular barrier function and solute transport in the healthy intestine. Its altered expression in colitis could reflect a reorganization of tight junctions in response to inflammation, potentially affecting intestinal permeability GeneCards: CLDN15.
Markers Upregulated in Healthy Controls (HC)
The markers highly expressed in HC samples are likely indicative of normal intestinal epithelial cell functions, including barrier integrity, nutrient absorption, and immune homeostasis, which are compromised during colitis.
- Lgr4 (Leucine-rich repeat-containing G-protein coupled receptor 4): Lgr4 is a critical component of the Wnt signaling pathway, essential for maintaining intestinal stem cell populations and driving epithelial regeneration. Its high expression in healthy cells underscores its role in epithelial homeostasis and self-renewal GeneCards: LGR4.
- Tnfrsf11a (RANK): While known for its role in bone metabolism, RANK and its ligand RANKL play roles in immune regulation and epithelial-immune crosstalk. In healthy intestinal epithelial cells, high RANK expression might contribute to maintaining immune tolerance or epithelial barrier integrity through specific signaling pathways GeneCards: TNFRSF11A.
- Dpp4 (CD26): Dipeptidyl peptidase 4, also known as CD26, is a multifunctional ectoenzyme involved in glucose metabolism, T-cell activation, and the degradation of various peptides including chemokines. In healthy intestinal epithelium, DPP4 may contribute to local peptide signaling and immune cell interactions, maintaining a balanced immune environment GeneCards: DPP4.
- Cldn2 (Claudin 2): Claudin 2 is a tight junction protein that forms cation-selective paracellular channels. While often associated with increased permeability ("leaky gut") in inflammatory conditions, its high expression in HC in this dataset suggests a baseline role in regulating ion and water transport across specific intestinal epithelial cell types under healthy physiological conditions, important for fluid balance and mucosal integrity GeneCards: CLDN2.
Clinical or Translational Implications
The identified condition-specific surfaceome markers in Intestinal Epithelial cells hold significant potential as therapeutic targets, diagnostic biomarkers, and indicators for monitoring disease progression or treatment response in Colitis.
Therapeutic Targets for Colitis:
- Duox2: Targeting Duox2 to reduce excessive ROS production could mitigate oxidative stress and inflammation in colitis. Agents that inhibit NADPH oxidases or scavenge ROS may offer therapeutic benefits.
- Prom1 (CD133): Given its role in epithelial regeneration but also potential association with dysplastic changes, modulating CD133 signaling could promote healthy regeneration while suppressing pathological growth. Strategies might involve inhibitors of stemness pathways or antibodies targeting CD133.
- Cd44: Inhibiting CD44 or its interactions with hyaluronic acid could reduce inflammatory cell infiltration and dampen pro-inflammatory signaling in the gut. Anti-CD44 antibodies or small molecule inhibitors are being investigated for inflammatory diseases and cancer.
- Egfr: While EGFR activation is crucial for repair, its dysregulation in colitis could be targeted. EGFR inhibitors, commonly used in oncology, might need careful consideration in inflammatory settings to balance regenerative needs with inflammation control.
- Cldn15: Modulating the expression or function of Cldn15 could help restore appropriate paracellular permeability and barrier function, a key challenge in colitis.
Promoting Healthy Epithelial Function:
- Lgr4: Enhancing Lgr4 signaling could bolster intestinal stem cell activity, promoting robust epithelial regeneration and mucosal healing in colitis. Wnt pathway modulators are areas of active research for regenerative medicine.
- Tnfrsf11a (RANK) & Dpp4 (CD26): Understanding the precise roles of these markers in healthy epithelial-immune crosstalk could lead to novel strategies for maintaining immune tolerance and epithelial integrity. For instance, DPP4 inhibitors are established drugs for type 2 diabetes, and their repurposing or specific targeting in colitis might influence gut peptide hormones and immune cell function.
- Diagnostic and Prognostic Biomarkers: The distinct expression patterns of these surface markers could be leveraged for diagnostic purposes, potentially enabling non-invasive monitoring of disease activity or distinguishing between acute and chronic phases of colitis. They could also serve as prognostic markers, predicting disease severity or response to specific therapies.
- Experimental Validation: Further experimental validation using organoid models, *in vivo* colitis models, and patient samples would be crucial to confirm the functional significance of these markers and explore their precise roles in colitis pathogenesis and resolution. Investigation into potential ligand-receptor interactions involving these surface proteins could also reveal critical cell-cell communication pathways in the inflamed colon.
12. Macrophage Condition-Specific Surfaceome Markers in Colitis
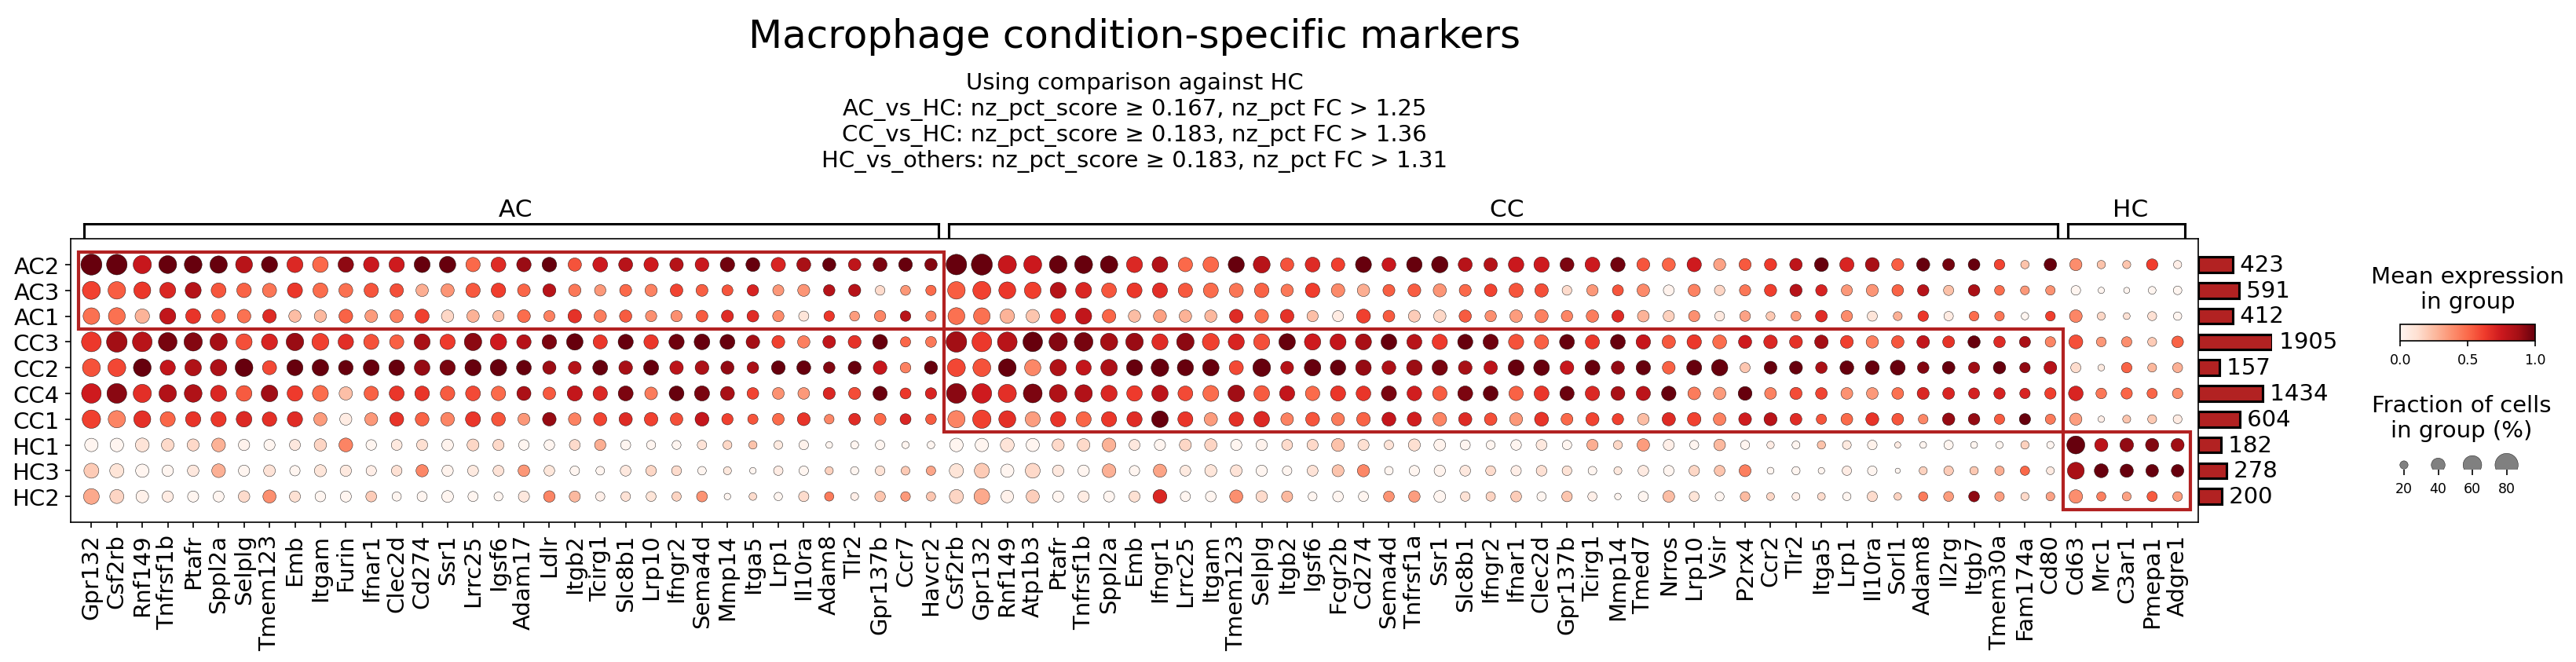
[Analysis Visualization Results]...
Analysis Overview
This analysis investigates the expression patterns of surfaceome markers on macrophages across different conditions in mouse colon tissue: Acute Colitis (AC), Chronic Colitis (CC), and Healthy Controls (HC). The goal is to identify condition-specific markers that provide insights into macrophage phenotypes and functions during acute and chronic inflammation, and to evaluate their potential as therapeutic targets for Colitis. Differential expression analysis (DEG_vs_ref) comparing each condition against the Healthy Control (HC) was performed to identify these markers.
Visual Summary
The dot plot visualizes the expression of selected surfaceome markers in macrophages from individual samples, grouped by condition (AC, CC, HC).
- AC-specific markers: The left-most group of markers (e.g., *Gpr132, Csf2rb, Tnfrsf1b, Ptafr, Itgam, Cd274, Havcr2*) shows consistently high mean expression (darker red color) and a high fraction of expressing cells (larger dot size) in AC samples, with markedly lower or absent expression in HC samples.
- CC-specific markers: The middle group of markers (e.g., *Tlr2, Ccr2, Mmp14, Mrc1, Il10ra*) demonstrates elevated expression and fraction of cells in CC samples compared to HC. There is significant overlap with markers also upregulated in AC, suggesting shared inflammatory pathways, but also distinct markers or more sustained expression patterns in chronic colitis. For example, *Tlr2, Ccr2, Mmp14* show strong expression in CC.
- HC-enriched markers: A smaller group of markers towards the right (e.g., *Cd63, Mrc1, C3ar1, Pmeepa1, Adgre1*) exhibits higher expression in HC samples. Interestingly, some of these markers, particularly *Mrc1 (CD206)* and *Adgre1 (F4/80)*, also show considerable expression in CC samples, albeit often with varied fraction of cells compared to HC, suggesting a complex macrophage phenotype in chronic inflammation that may include elements of both homeostatic and activated states, unlike the pronounced shift seen in acute colitis.
Overall, the plot reveals distinct macrophage surfaceome signatures that differentiate healthy, acutely inflamed, and chronically inflamed colon environments, highlighting the dynamic roles of macrophages in Colitis progression.
Biological Interpretation
Macrophage populations undergo significant phenotypic and functional shifts in response to inflammatory stimuli. The observed condition-specific surfaceome markers provide insights into the activation states, migratory potential, immune regulatory functions, and tissue remodeling activities of macrophages in acute versus chronic colitis.
Markers Elevated in Acute Colitis (AC) Macrophages (vs. HC)
- Csf2rb (GM-CSFR beta chain): The robust upregulation of *Csf2rb* suggests increased responsiveness of macrophages to Granulocyte-Macrophage Colony-Stimulating Factor (GM-CSF). GM-CSF signaling is crucial for myeloid cell proliferation, survival, and differentiation towards a pro-inflammatory phenotype, contributing to the expansion and activation of macrophages in acute inflammation.
- Signaling Pathways & Mechanisms: GM-CSF binds to its receptor (comprising *Csf2ra* and *Csf2rb*), activating JAK/STAT, MAPK, and PI3K pathways, leading to enhanced macrophage survival, proliferation, and secretion of pro-inflammatory cytokines and chemokines. UniProt: Csf2rb
- Tnfrsf1b (TNFR2): Upregulation of Tumor Necrosis Factor Receptor 2 indicates increased sensitivity to TNF-α, a central cytokine in inflammation. TNFR2 signaling typically promotes cell survival, proliferation, and tissue repair, but in acute settings, can also contribute to the perpetuation of inflammatory responses by sustaining macrophage viability and specific cytokine production.
- Signaling Pathways & Mechanisms: TNF-α binding to TNFR2 recruits TRAF adapter proteins, activating NF-κB and MAPK pathways, leading to gene expression related to inflammation, cell survival, and proliferation. GeneCards: TNFRSF1B
- Itgam (CD11b): This integrin subunit, forming part of the Mac-1 complex (CD11b/CD18), is critical for leukocyte adhesion, migration, and phagocytosis. Its high expression in AC macrophages indicates their enhanced capacity for extravasation into inflamed tissue, engulfment of pathogens and debris, and effector functions in the acute immune response.
- Signaling Pathways & Mechanisms: Integrin signaling, activated by ligand binding (e.g., ICAMs), leads to cytoskeletal reorganization, cell adhesion, migration, and activation of signaling cascades involving FAK and Src kinases. GeneCards: ITGAM
- Cd274 (PD-L1): Programmed Death-Ligand 1, an immune checkpoint molecule, is often upregulated on macrophages during inflammation. While commonly associated with immune evasion in cancer, its expression in acute colitis macrophages might represent a regulatory mechanism to temper excessive T cell activation and prevent overt tissue damage, or could indicate a state of macrophage exhaustion.
- Signaling Pathways & Mechanisms: PD-L1 binding to PD-1 on T cells inhibits T cell receptor signaling, reducing T cell proliferation and cytokine production. PubMed: PD-L1 colitis
- Ptafr (Platelet-activating factor receptor): Platelet-activating factor (PAF) is a potent lipid mediator of inflammation. Upregulation of *Ptafr* suggests increased macrophage responsiveness to PAF, driving chemotaxis, oxidative burst, and release of inflammatory mediators, which are hallmarks of the acute inflammatory phase.
- Signaling Pathways & Mechanisms: PAF-Ptafr binding activates G-protein coupled receptor signaling, leading to intracellular calcium mobilization, phospholipase C activation, and downstream signaling pathways that promote inflammation. PubMed: Ptafr signaling inflammation
Markers Elevated in Chronic Colitis (CC) Macrophages (vs. HC)
- Tlr2 (Toll-like receptor 2): Sustained high expression of *Tlr2* in chronic colitis macrophages indicates continuous recognition of microbial components from the dysbiotic gut microbiota. This constant sensing contributes to the chronic activation of innate immune responses and the perpetuation of inflammation via pathways like NF-κB.
- Signaling Pathways & Mechanisms: TLR2 recognizes pathogen-associated molecular patterns (PAMPs) and initiates MyD88-dependent signaling, leading to activation of NF-κB and AP-1, and subsequent transcription of pro-inflammatory cytokines and chemokines. PubMed: TLR2 chronic inflammation
- Ccr2 (Chemokine (C-C motif) receptor 2): *Ccr2* is the receptor for CCL2 (MCP-1), a major chemokine for monocyte and macrophage recruitment. Its pronounced upregulation highlights the continuous influx of new monocytes into the inflamed colon, which differentiate into macrophages and sustain the inflammatory cellular infiltrate characteristic of chronic colitis.
- Signaling Pathways & Mechanisms: CCL2-CCR2 binding activates G-protein coupled receptor signaling, leading to cell migration, actin polymerization, and activation of various intracellular signaling cascades that mediate chemotaxis. PubMed: CCR2 macrophage recruitment colitis
- Mmp14 (Matrix metallopeptidase 14): As a membrane-bound matrix metalloproteinase, *Mmp14* plays a key role in extracellular matrix (ECM) degradation and remodeling. Its upregulation signifies active tissue destruction and fibrosis, allowing inflammatory cells to migrate through tissue and contributing to the structural damage seen in chronic inflammatory conditions like colitis.
- Signaling Pathways & Mechanisms: MMP14 cleaves various ECM components and activates other MMPs, facilitating cell invasion and tissue breakdown. Its activity is regulated by various signaling pathways, including growth factor and cytokine signaling. GeneCards: MMP14
- Mrc1 (CD206): Mannose receptor C-type 1 (*Mrc1* or CD206) is a scavenger receptor often associated with M2-like macrophages involved in immune regulation, efferocytosis, and tissue repair. Its substantial expression in CC macrophages, compared to its lower levels in AC, suggests the presence of macrophages attempting to resolve inflammation or engage in reparative processes. However, dysfunctional M2 responses can also contribute to chronic fibrosis.
- Signaling Pathways & Mechanisms: CD206 mediates endocytosis of glycosylated ligands, antigen presentation, and can modulate immune responses. Its expression is often induced by anti-inflammatory cytokines like IL-4 and IL-13. UniProt: Mrc1
- Il10ra (IL-10 receptor alpha): Interleukin-10 (IL-10) is a potent anti-inflammatory cytokine. The upregulation of *Il10ra* in CC macrophages suggests increased sensitivity to IL-10, potentially representing an endogenous feedback mechanism attempting to dampen the chronic inflammatory response. However, if IL-10 production is insufficient or signaling is impaired, chronic inflammation can persist despite receptor availability.
- Signaling Pathways & Mechanisms: IL-10 binding to *Il10ra* activates the JAK/STAT3 pathway, leading to the transcription of genes that suppress pro-inflammatory cytokine production and enhance immune regulatory functions. PubMed: IL-10 signaling colitis
Markers Enriched in Healthy Control (HC) Macrophages
- Adgre1 (F4/80): F4/80 is a well-established classical marker for macrophages in mice. Its high expression in HC macrophages indicates a healthy, tissue-resident macrophage population involved in homeostatic functions. The reduced expression in AC suggests a shift away from this homeostatic state during acute inflammation, while its re-expression or presence in CC implies the persistence of certain resident macrophage subsets or the differentiation of infiltrating monocytes towards a more 'tissue-like' but still altered phenotype in chronic disease.
- Signaling Pathways & Mechanisms: Adgre1 is an adhesion G protein-coupled receptor. Its precise signaling is complex, but it is involved in macrophage adhesion, identification, and various homeostatic functions. GeneCards: ADGRE1
Clinical or Translational Implications
The identification of condition-specific surfaceome markers on macrophages offers valuable insights for developing diagnostic biomarkers and therapeutic strategies for Colitis.
Diagnostic and Prognostic Biomarkers:
- Markers like Csf2rb, Tnfrsf1b, Ptafr, Itgam, Cd274, and Havcr2 could serve as biomarkers for acute inflammatory flares in colitis, reflecting the activation and recruitment of specific macrophage subsets.
- Markers such as Tlr2, Ccr2, and Mmp14 could indicate chronic disease activity, severity, and potential for fibrosis, helping to differentiate chronic from acute stages and monitor disease progression.
- The dynamic expression of Mrc1 (CD206) and Adgre1 (F4/80) could provide insights into macrophage polarization states, potentially distinguishing between inflammatory (e.g., M1-like) and reparative/regulatory (e.g., M2-like) responses.
Therapeutic Targets for Colitis:
Targeting Pro-inflammatory Pathways in AC and CC:
- Csf2rb: Blocking GM-CSF receptor signaling could reduce macrophage proliferation and pro-inflammatory cytokine production. Antibodies targeting GM-CSF or its receptor are already in clinical development for autoimmune diseases.
- Ptafr: PAF receptor antagonists could mitigate acute inflammatory responses, including chemotaxis and cytokine release, in early stages of colitis.
- Tlr2: Inhibitors of TLR2 signaling could dampen chronic inflammation driven by microbial sensing in the gut, thereby reducing NF-κB activation and downstream inflammatory mediators.
- Ccr2: Antagonists for CCR2 could block the recruitment of pathogenic monocytes/macrophages to the inflamed colon, a strategy with ongoing investigation in inflammatory bowel diseases (IBD). PubMed: CCR2 antagonist IBD
- Mmp14: Inhibiting MMP14 activity specifically in macrophages could reduce tissue degradation and fibrosis, potentially limiting chronic tissue damage and improving mucosal healing in colitis.
Modulating Immune Checkpoints and Regulatory Pathways:
- Cd274 (PD-L1) and Havcr2 (TIM-3): While typically targeted in cancer to enhance anti-tumor immunity, modulating these immune checkpoints on macrophages in colitis is a nuanced area. Depending on the context, agonists or antagonists could either temper hyper-inflammation or boost protective immune responses.
- Il10ra: Therapies aimed at enhancing IL-10 signaling, either through exogenous IL-10 administration or targeting factors that improve IL-10 receptor function, could reinforce anti-inflammatory pathways in chronic colitis.
- Macrophage Reprogramming: Understanding the factors that drive the expression of markers like Mrc1 (CD206) and Adgre1 (F4/80) in healthy or resolving inflammation could lead to strategies to reprogram pathogenic macrophages towards a more homeostatic or reparative phenotype.
Further experimental validation is required to confirm the functional roles of these surfaceome markers and their precise contribution to colitis pathology, paving the way for targeted therapeutic interventions.
13. Fibroblast Condition-Specific Surfaceome Markers in Colitis
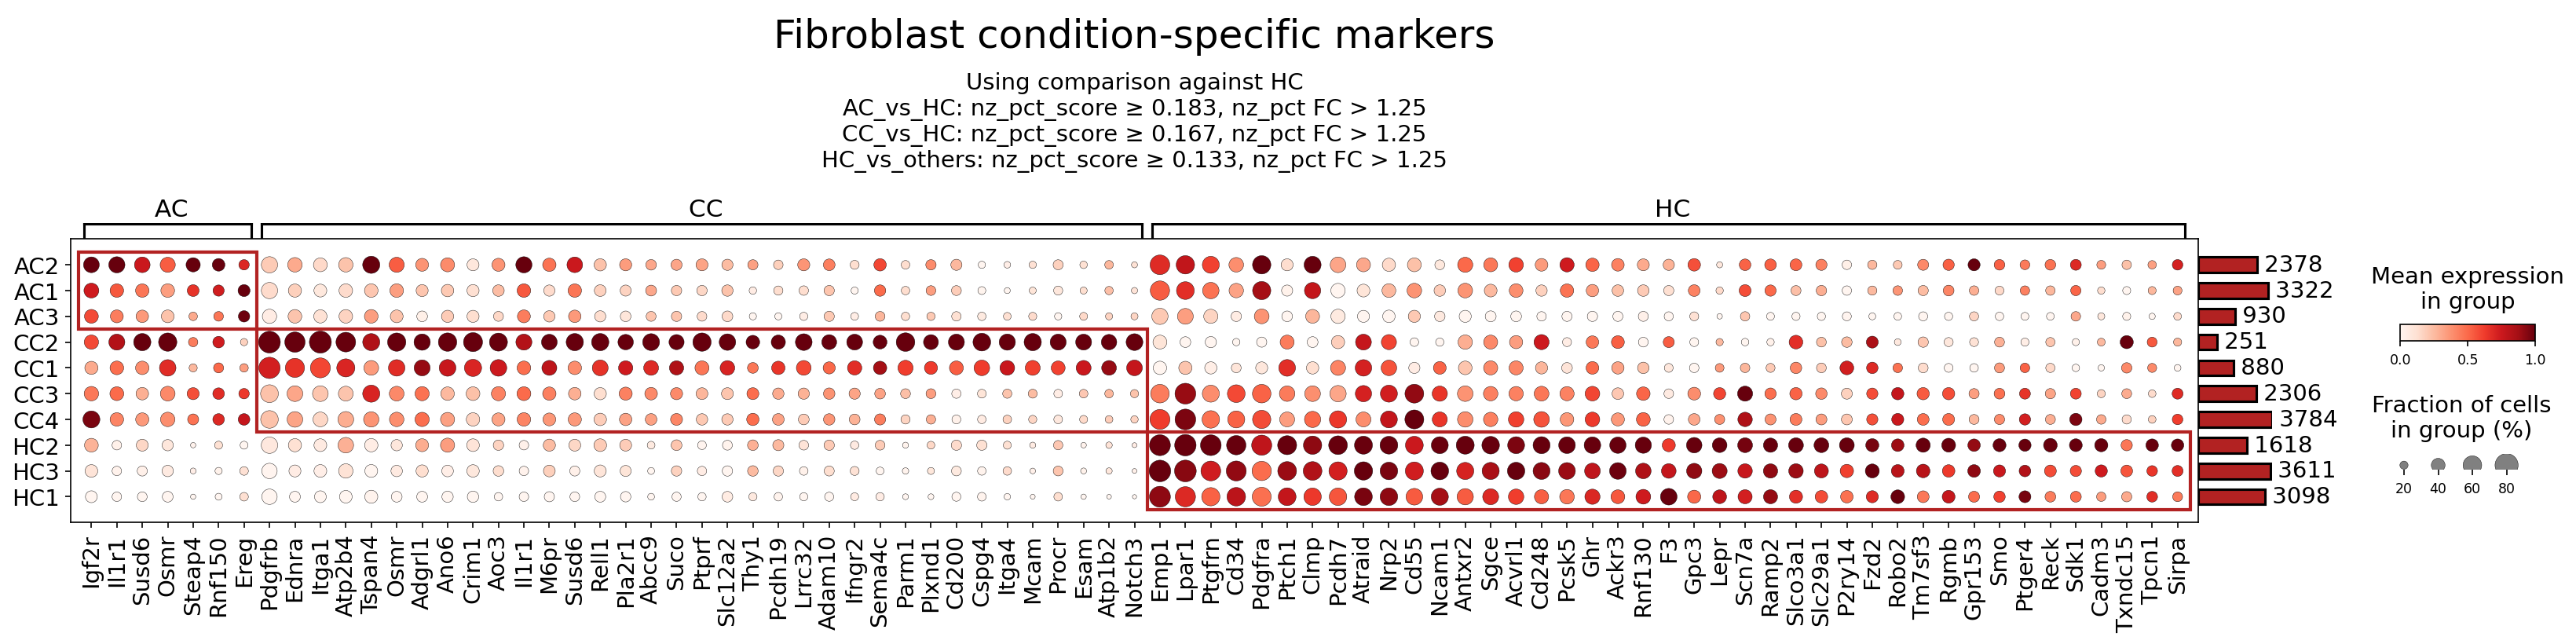
[Analysis Visualization Results]...
Analysis Overview
This analysis highlights surfaceome markers differentially expressed in Fibroblast cells across Acute Colitis (AC), Chronic Colitis (CC), and Healthy Control (HC) conditions within mouse colon tissue. The identification of markers involved a comparison of each disease condition against the reference condition, HC, specifically focusing on surfaceome-expressed genes. The resulting dot plot visualizes both the mean expression level (color intensity) and the fraction of cells expressing each marker (dot size) for individual samples within each condition. This approach aims to characterize distinct fibroblast activation states and phenotypes that are specific to acute inflammation, chronic inflammatory pathology, and tissue homeostasis in the colon.
Visual Summary
The dot plot reveals a clear and distinct pattern of fibroblast surfaceome marker expression across the three conditions, indicating condition-specific fibroblast phenotypes:
- Healthy Control (HC) Fibroblasts: A prominent cluster of markers (e.g., *Pdgfra*, *Emp1*, *Lpar1*, *Cd34*, *Lepr*, *Ptger4*, *Fzd2*) is highly expressed and prevalent across all HC samples. These markers are generally either absent or expressed at very low levels in both AC and CC conditions, suggesting a signature of quiescent, homeostatic, or protective fibroblast populations.
- Acute Colitis (AC) Fibroblasts: A smaller but distinct set of markers shows elevated expression and prevalence specifically in AC samples (e.g., *Igf2r*, *Il1r1*, *Susd6*, *Osmr*, *Steap4*, *Rnf150*, *Ereg*). These markers are largely absent in HC and generally at lower levels compared to CC, indicating a unique fibroblast activation state during the acute inflammatory phase.
- Chronic Colitis (CC) Fibroblasts: A robust and widespread set of markers is strongly upregulated and highly prevalent in CC samples (e.g., *Pdgfrb*, *Ednra*, *Itga1*, *Atp2b4*, *Tspan4*, *Ano6*, *Crim1*, *Aoc3*). These markers are typically expressed at lower levels in AC and largely absent in HC. This pattern strongly suggests a fibrotic or highly activated fibroblast phenotype, characteristic of ongoing chronic inflammation and significant tissue remodeling.
- Overlap and Graded Expression: While many markers are highly specific to a single condition, some exhibit a graded increase from HC to AC to CC (e.g., *Ano6*, *Crim1*), suggesting a continuum of fibroblast activation during disease progression. The stringent filtering criteria (nz_pct_score and nz_pct FC) applied ensure that the depicted markers represent biologically significant differential expression against the healthy reference.
Biological Interpretation
The observed condition-specific surfaceome marker profiles provide critical insights into distinct fibroblast phenotypes and their potential roles in the pathogenesis of colitis.
Markers Predominantly Expressed by Acute Colitis (AC) Fibroblasts:
- Igf2r (Insulin-like growth factor 2 receptor): This receptor binds IGF-2, promoting cell growth, proliferation, and survival. It also interacts with latent TGF-β, suggesting a role in regulating its activation and thus influencing fibrosis UniProt: P17424. Its upregulation in AC fibroblasts may indicate an early, dysregulated proliferative and repair response to acute injury.
- Il1r1 (Interleukin 1 receptor type 1): As the primary receptor for pro-inflammatory cytokines IL-1α and IL-1β, activation of IL1R1 initiates powerful inflammatory signaling pathways (e.g., NF-κB, MAPK), leading to further cytokine production and tissue damage GeneCards: IL1R1. High expression on AC fibroblasts indicates their direct responsiveness to acute inflammatory signals and their active participation in the early inflammatory cascade.
- Osmr (Oncostatin M receptor): Oncostatin M (OSM), produced by immune cells, signals through OSMR to induce inflammation, fibrosis, and tissue remodeling. In the colon, OSMR activation in fibroblasts can stimulate extracellular matrix production and inflammatory mediators, contributing to chronic inflammation and fibrosis PubMed: 28882069. Its upregulation in AC may signify the initiation of pro-fibrotic and inflammatory pathways that can lead to disease chronicity if unresolved.
- Ereg (Epiregulin): An epidermal growth factor (EGF) family member, EREG activates the EGFR, promoting cell proliferation, migration, and angiogenesis. In inflammatory conditions, EREG can contribute to epithelial repair, but also exhibits pro-inflammatory and pro-fibrotic activities GeneCards: EREG. Its presence in AC fibroblasts may reflect simultaneous processes of damage, repair, and ongoing inflammation.
Markers Predominantly Expressed by Chronic Colitis (CC) Fibroblasts:
- Pdgfrb (Platelet-derived growth factor receptor beta): PDGF-BB, a ligand for PDGFRB, is a potent mitogen and chemoattractant for fibroblasts. It drives their proliferation, differentiation into myofibroblasts, and synthesis of extracellular matrix, which are central to fibrogenesis in the intestine and lead to stricture formation in chronic colitis PubMed: 29581373. High expression of PDGFRB in CC fibroblasts is a strong indicator of active fibrotic processes.
- Ednra (Endothelin receptor type A): EDNRA binds endothelin-1 (ET-1), a potent vasoconstrictor and mitogen. ET-1/EDNRA signaling significantly promotes fibroblast activation, proliferation, and collagen production, thus contributing to tissue remodeling and fibrosis in chronic inflammatory conditions UniProt: P25101. Its upregulation in CC aligns well with the fibrotic characteristics of chronic colitis.
- Itga1 (Integrin alpha-1): Integrins are cell surface receptors mediating cell-extracellular matrix (ECM) interactions. ITGA1, forming a heterodimer with ITGB1 (VLA-1), binds collagen and laminin. ITGA1/ITGB1 signaling influences fibroblast adhesion, migration, and activation, playing a role in tissue remodeling and wound healing GeneCards: ITGA1. Its presence suggests altered ECM interactions and enhanced fibroblast activity in the chronically inflamed colon.
- Ano6 (Anoctamin 6 / TMEM16F): A calcium-activated chloride channel and phospholipid scramblase, ANO6 is involved in membrane repair, cell migration, and potentially in inflammation by regulating exosome release and immune cell activation PubMed: 31719543. Its upregulation in CC could signify increased membrane trafficking, heightened cell repair mechanisms, or active inflammatory signaling within activated fibroblasts.
Markers Predominantly Expressed by Healthy Control (HC) Fibroblasts:
- Pdgfra (Platelet-derived growth factor receptor alpha): In contrast to PDGFRB, PDGRA-expressing fibroblasts are often considered a more quiescent or progenitor-like population, involved in tissue maintenance and homeostatic niche signaling rather than active fibrosis PubMed: 27959828. Its downregulation in AC and CC suggests a pathological shift away from this homeostatic fibroblast state during colitis.
- Cd34 (Cluster of Differentiation 34): CD34 is a surface glycoprotein associated with various stem/progenitor cells and certain stromal fibroblast populations. In some contexts, CD34+ fibroblasts are considered quiescent or anti-fibrotic PubMed: 29773449. Its robust expression in HC fibroblasts and reduction in colitis conditions might indicate the loss of a protective or homeostatic fibroblast subset.
- Lepr (Leptin receptor): LEPR mediates the effects of leptin, a hormone involved in energy homeostasis, inflammation, immune responses, and fibrosis GeneCards: LEPR. High expression on HC fibroblasts may represent a baseline metabolic or regulatory function under healthy conditions, potentially altered or suppressed during inflammation.
- Ptger4 (Prostaglandin E receptor 4 / EP4): EP4 is one of the receptors for prostaglandin E2 (PGE2). PGE2-EP4 signaling typically exerts anti-inflammatory and immunosuppressive effects, promoting tissue homeostasis and inflammation resolution PubMed: 23412797. Its strong expression in HC fibroblasts suggests a role in maintaining immune tolerance and suppressing inflammation in the healthy colon, and its reduction in colitis could contribute to uncontrolled inflammation.
Clinical or Translational Implications
The identification of these condition-specific fibroblast surfaceome markers provides a valuable foundation for advancing our understanding of colitis pathogenesis and for developing novel targeted therapeutic strategies.
- Diagnostic and Prognostic Biomarkers: The distinct expression profiles of surfaceome markers in AC, CC, and HC fibroblasts could serve as powerful biomarkers for diagnosing the specific stage of colitis (acute vs. chronic), monitoring disease activity, predicting disease progression, or assessing therapeutic response. For instance, a high expression of PDGFRB could indicate a more severe fibrotic phenotype requiring aggressive intervention.
Therapeutic Targets for Fibrosis in Chronic Colitis:
- PDGFRB: Due to its central role in fibroblast activation and fibrogenesis, targeting PDGFRB signaling is a highly promising therapeutic strategy. Tyrosine kinase inhibitors (TKIs) like imatinib, nilotinib, or masitinib, which inhibit PDGFR activity, are already utilized in other fibrotic diseases and malignancies. Repurposing or developing novel, specific PDGFRB inhibitors could effectively mitigate intestinal fibrosis and prevent stricture formation in CC PubMed: 29581373.
- EDNRA: Blockade of EDNRA, for example with endothelin receptor antagonists like bosentan or ambrisentan (used for pulmonary hypertension), could modulate fibroblast activation and collagen production, thereby reducing fibrosis in CC PubMed: 25193988.
- OSMR: Given that OSMR promotes both inflammation and fibrosis, its inhibition could offer a dual therapeutic benefit in colitis. Antibodies targeting OSM or OSMR are currently under investigation for various inflammatory and fibrotic conditions PubMed: 30999933.
Modulating Acute Inflammatory Responses:
- IL1R1: Blocking IL1R1 signaling using an IL-1 receptor antagonist like anakinra (established in other inflammatory diseases) could effectively dampen the acute inflammatory response in AC, potentially preventing disease chronicity or severe flare-ups PubMed: 18458737.
- EREG: While EREG can promote tissue repair, its excessive or prolonged signaling might exacerbate inflammation or contribute to dysplastic changes. Inhibiting EGFR, which EREG activates, could be considered, though careful consideration of off-target effects would be necessary.
Restoring Homeostatic Fibroblast Functions:
- PTGER4 agonists: The high expression of PTGER4 in HC and its reduction in colitis suggest that agonists of EP4 could potentially be employed to dampen inflammation and promote tissue repair or the resolution of inflammation in both AC and CC. Selective EP4 agonists are being explored for their anti-inflammatory and pro-healing properties in various disease models PubMed: 23412797.
- CD34: Further research into mechanisms to maintain or restore the CD34+ fibroblast population, or to prevent their pathological phenotypic shift during colitis, could represent a strategy to preserve intestinal integrity and mitigate fibrosis.
- Experimental Validation: These findings warrant further experimental validation. This includes *in vitro* studies using fibroblast cultures derived from colitis patients or models, as well as *in vivo* studies utilizing genetic deletions or pharmacological inhibitors in established mouse colitis models. Techniques such as flow cytometry, immunohistochemistry, or spatial transcriptomics focusing on these surface markers would be crucial to confirm their utility as patient stratification tools or as readouts for therapeutic efficacy.
14. T cell CD4+ Condition-Specific Surfaceome Markers in Colitis
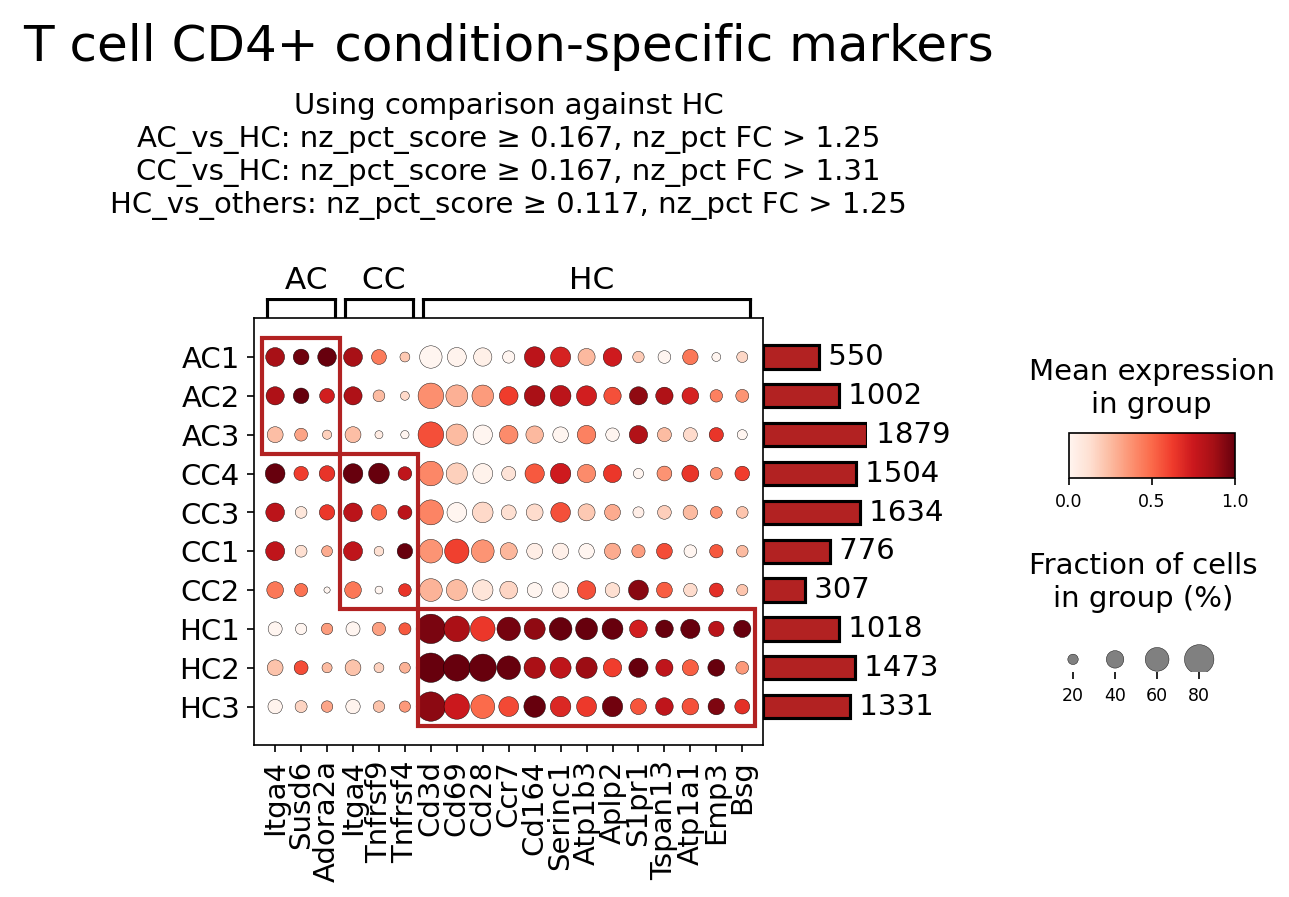
[Analysis Visualization Results]...
Analysis Overview
This analysis identifies condition-specific surfaceome markers for T cell CD4+ populations across different experimental conditions: Acute Colitis (AC), Chronic Colitis (CC), and Healthy Controls (HC) in mouse colon tissue. The analysis employed a dot plot visualization to display the mean expression level and the fraction of cells expressing each marker for individual samples within these conditions. Markers were selected based on differential expression criteria (nz_pct_score, fold change) comparing conditions against HC or against other conditions, focusing on surfaceome genes. This provides insights into phenotypic shifts and potential functional states of CD4+ T cells during different stages of colitis.
Visual Summary
The dot plot visualizes the expression of 23 surfaceome markers across 8 samples (AC1-3, CC1-4, HC1-3) belonging to the T cell CD4+ population.
- Expression Patterns: Each dot's color intensity represents the mean expression level (darker red indicates higher expression), and its size represents the fraction of cells expressing the marker within that sample (larger dot indicates a higher percentage of expressing cells).
Condition-Specific Markers:
- A distinct cluster of markers (left red box: Itga4, Susd6, Adora2a, Tnfrsf4, Tnfrsf9) shows high expression and high prevalence in AC and CC samples, particularly in CC samples. This indicates these markers are upregulated in colitic conditions.
- Conversely, a larger cluster of markers (right red box: Cd3d, Cd69, Cd28, Ccr7, Cd164, Serinc1, Atp1b3, Aplp2, S1pr1, Tspan13, Atp1a1, Emp3, Bsg) shows robust expression and high prevalence predominantly in HC samples, with markedly reduced expression in AC and CC samples. These are characteristic markers of T cell CD4+ in healthy colon tissue.
- Sample Heterogeneity: While general patterns are clear, some heterogeneity is observed within conditions (e.g., AC3 shows somewhat lower expression of the AC/CC-enriched markers compared to AC1/AC2, and CC2 shows lower expression of HC-enriched markers compared to other CC samples but still higher than AC).
- Cell Counts: The bar plot on the right indicates the total number of T cell CD4+ cells for each sample, ranging from 307 to 1879 cells, suggesting sufficient cell numbers for reliable marker detection.
Biological Interpretation
The distinct expression profiles of surfaceome markers in T cell CD4+ populations between colitic (AC, CC) and healthy (HC) conditions highlight significant changes in T cell phenotype, activation state, and migratory potential during intestinal inflammation.
Markers Predominantly Upregulated in Colitis (AC/CC) CD4+ T cells
These markers are associated with T cell activation, tissue homing, and sustained inflammatory responses characteristic of colitis.
- Itga4 (Integrin alpha-4): This subunit is crucial for forming integrins α4β1 (VLA-4) and α4β7. Both integrins mediate cell adhesion and are vital for lymphocyte extravasation into inflamed tissues. Specifically, α4β7 binds MAdCAM-1, a key adhesion molecule expressed on endothelial cells of the gut, facilitating the homing of lymphocytes to the intestinal mucosa. Its upregulation suggests enhanced recruitment of CD4+ T cells to the inflamed colon. GeneCards: ITGA4
- Tnfrsf4 (OX40, CD134): A co-stimulatory receptor belonging to the TNF receptor superfamily. Upon binding its ligand OX40L (TNFSF4) on antigen-presenting cells (APCs), OX40 delivers a critical signal that promotes T cell proliferation, survival, and cytokine production. It is particularly important for sustaining effector and memory T cell responses and can inhibit regulatory T cell functions, thereby augmenting pro-inflammatory responses. Upregulation indicates activated, pro-inflammatory CD4+ T cells. GeneCards: TNFRSF4
- Tnfrsf9 (4-1BB, CD137): Another TNF receptor superfamily co-stimulatory molecule, 4-1BB, binds 4-1BBL. It enhances the proliferation, survival, and effector functions of activated T cells. Its upregulation in colitis suggests sustained T cell activation and participation in chronic inflammatory processes. GeneCards: TNFRSF9
- Adora2a (Adenosine A2a receptor): A G protein-coupled receptor for adenosine, an endogenous nucleoside abundant in inflamed tissues. Activation of A2aR on T cells generally mediates immunosuppressive effects, inhibiting effector T cell functions and cytokine production, thus serving as a negative feedback mechanism to control inflammation. Its upregulation might represent a compensatory, endogenous attempt to dampen the excessive immune response in colitis, or T cells responding to the high adenosine levels in the inflamed microenvironment. GeneCards: ADORA2A
- Susd6 (Sushi domain containing 6): A member of the sushi domain-containing protein family. While its precise role in CD4+ T cell function during colitis is less extensively characterized than other markers, proteins with sushi domains are often involved in cell adhesion, immune recognition, and complement regulation. Its upregulation may indicate a role in modulating cell-cell interactions or responses to the inflammatory microenvironment. GeneCards: SUSD6
Markers Predominantly Upregulated in Healthy Control (HC) CD4+ T cells
These markers typically characterize quiescent, naive, or recirculating T cell populations involved in immune surveillance, and their downregulation in colitis reflects the phenotypic shift towards activated, tissue-resident effector cells.
- Cd3d (CD3 delta subunit): An essential component of the T cell receptor (TCR) complex, indispensable for its surface expression and signal transduction upon antigen recognition. High expression in HC indicates a functional and intact TCR complex on resting or recirculating T cells. Its relative decrease in colitic conditions may suggest TCR modulation, internalization, or altered T cell states under chronic activation. GeneCards: CD3D
- Cd28 (CD28): A crucial co-stimulatory receptor on T cells that binds CD80/CD86 on APCs. It provides the essential "second signal" for full T cell activation, proliferation, survival, and cytokine production. Robust expression in HC CD4+ T cells signifies their capacity for potent initial activation. Its relative reduction in AC/CC could suggest a shift in co-stimulatory pathways, T cell anergy, or exhaustion in chronic inflammation. GeneCards: CD28
- Ccr7 (CC chemokine receptor 7): A chemokine receptor critical for the homing of naive and central memory T cells to secondary lymphoid organs (e.g., lymph nodes, Peyer's patches) by binding chemokines CCL19 and CCL21. High expression in HC indicates T cells capable of immune surveillance and recirculation. Its reduced expression in AC/CC CD4+ T cells is characteristic of effector T cells that have migrated into inflamed tissues and downregulate CCR7 to be retained locally. GeneCards: CCR7
- S1pr1 (Sphingosine-1-phosphate receptor 1): A G protein-coupled receptor for sphingosine-1-phosphate (S1P), a lipid mediator. S1PR1 is essential for lymphocyte egress from lymphoid organs into the blood circulation. High expression in HC enables normal T cell recirculation. Its lower expression in AC/CC T cells is consistent with the retention of activated effector T cells within the inflamed colon, a mechanism to sustain local inflammation. GeneCards: S1PR1
- Cd69 (CD69): An early activation marker for lymphocytes. While typically associated with recent activation, its sustained expression can also contribute to lymphocyte retention in tissues by internalizing S1PR1. Its higher expression in HC could suggest a population of tissue-resident memory or 'primed' T cells involved in local immune surveillance in the healthy colon. The relative decrease in active colitis might imply a different activation state or exhaustion. GeneCards: CD69
- Other HC-enriched markers (Cd164, Serinc1, Atp1b3, Aplp2, Tspan13, Atp1a1, Emp3, Bsg): These are surface-associated or transmembrane proteins involved in various cellular processes such as adhesion (Cd164, Bsg), metabolism (Serinc1, Atp1b3, Atp1a1), or structural roles (Aplp2, Tspan13, Emp3). Their higher expression in HC CD4+ T cells might reflect a homeostatic phenotype with specific metabolic or adhesive properties distinct from the inflammatory conditions, though their direct roles in T cell-mediated colitis pathogenesis are less prominent compared to adhesion molecules or co-stimulatory receptors.
Clinical or Translational Implications
The identified condition-specific surfaceome markers in CD4+ T cells offer potential insights for therapeutic targeting and diagnostic approaches in colitis.
Therapeutic Targets for Colitis:
- Itga4 (Integrin alpha-4): Integrins are well-established therapeutic targets for inflammatory bowel disease (IBD). Blocking α4β7 integrin with antibodies like Vedolizumab is an effective strategy to prevent pathogenic lymphocytes from homing to the inflamed gut, significantly reducing inflammation in ulcerative colitis and Crohn's disease. PubMed: Integrin targeting in IBD
- Tnfrsf4 (OX40): As a key co-stimulatory molecule driving T cell activation and effector function, OX40 represents a promising target for dampening excessive immune responses. Therapeutic antibodies targeting OX40 are under investigation for autoimmune diseases, aiming to inhibit pathogenic T cell activity. PubMed: OX40 in autoimmune diseases
- Tnfrsf9 (4-1BB): While 4-1BB agonists are primarily used in cancer immunotherapy, strategies to modulate its signaling, possibly with antagonists, might be explored to mitigate the sustained T cell activation in colitis, although this requires careful consideration due to its complex roles in immunity.
- S1pr1 (Sphingosine-1-phosphate receptor 1): S1PR1 modulators are a recognized class of drugs in autoimmune diseases. By functionally antagonizing S1PR1, these agents (e.g., Ozanimod, approved for ulcerative colitis) prevent lymphocytes from exiting lymphoid organs, thereby reducing the number of circulating pathogenic T cells available to infiltrate and exacerbate inflammation in the colon. PubMed: S1P modulators in IBD
- Biomarkers of Disease State: The differential expression patterns of these surfaceome markers could serve as valuable biomarkers for diagnosing colitis, monitoring disease activity, or predicting response to therapies. For instance, high expression of Itga4 or Tnfrsf4 might indicate active inflammation requiring intervention, while changes in Ccr7 or S1pr1 could reflect alterations in T cell trafficking patterns.
- Understanding Pathogenesis: The shift from a Ccr7- and S1pr1-high recirculating phenotype in healthy controls to Itga4- and Tnfrsf4/9-high activated, tissue-homing phenotypes in colitis provides a clear molecular signature of disease progression. This underscores the importance of T cell migration and sustained activation in colitis pathogenesis.
In summary, this analysis reveals significant condition-specific alterations in the surfaceome of CD4+ T cells during colitis, providing strong candidates for further investigation as therapeutic targets and biomarkers.
15. Gene Ontology (GSA) Analysis of Intestinal Epithelial Cells in Colitis
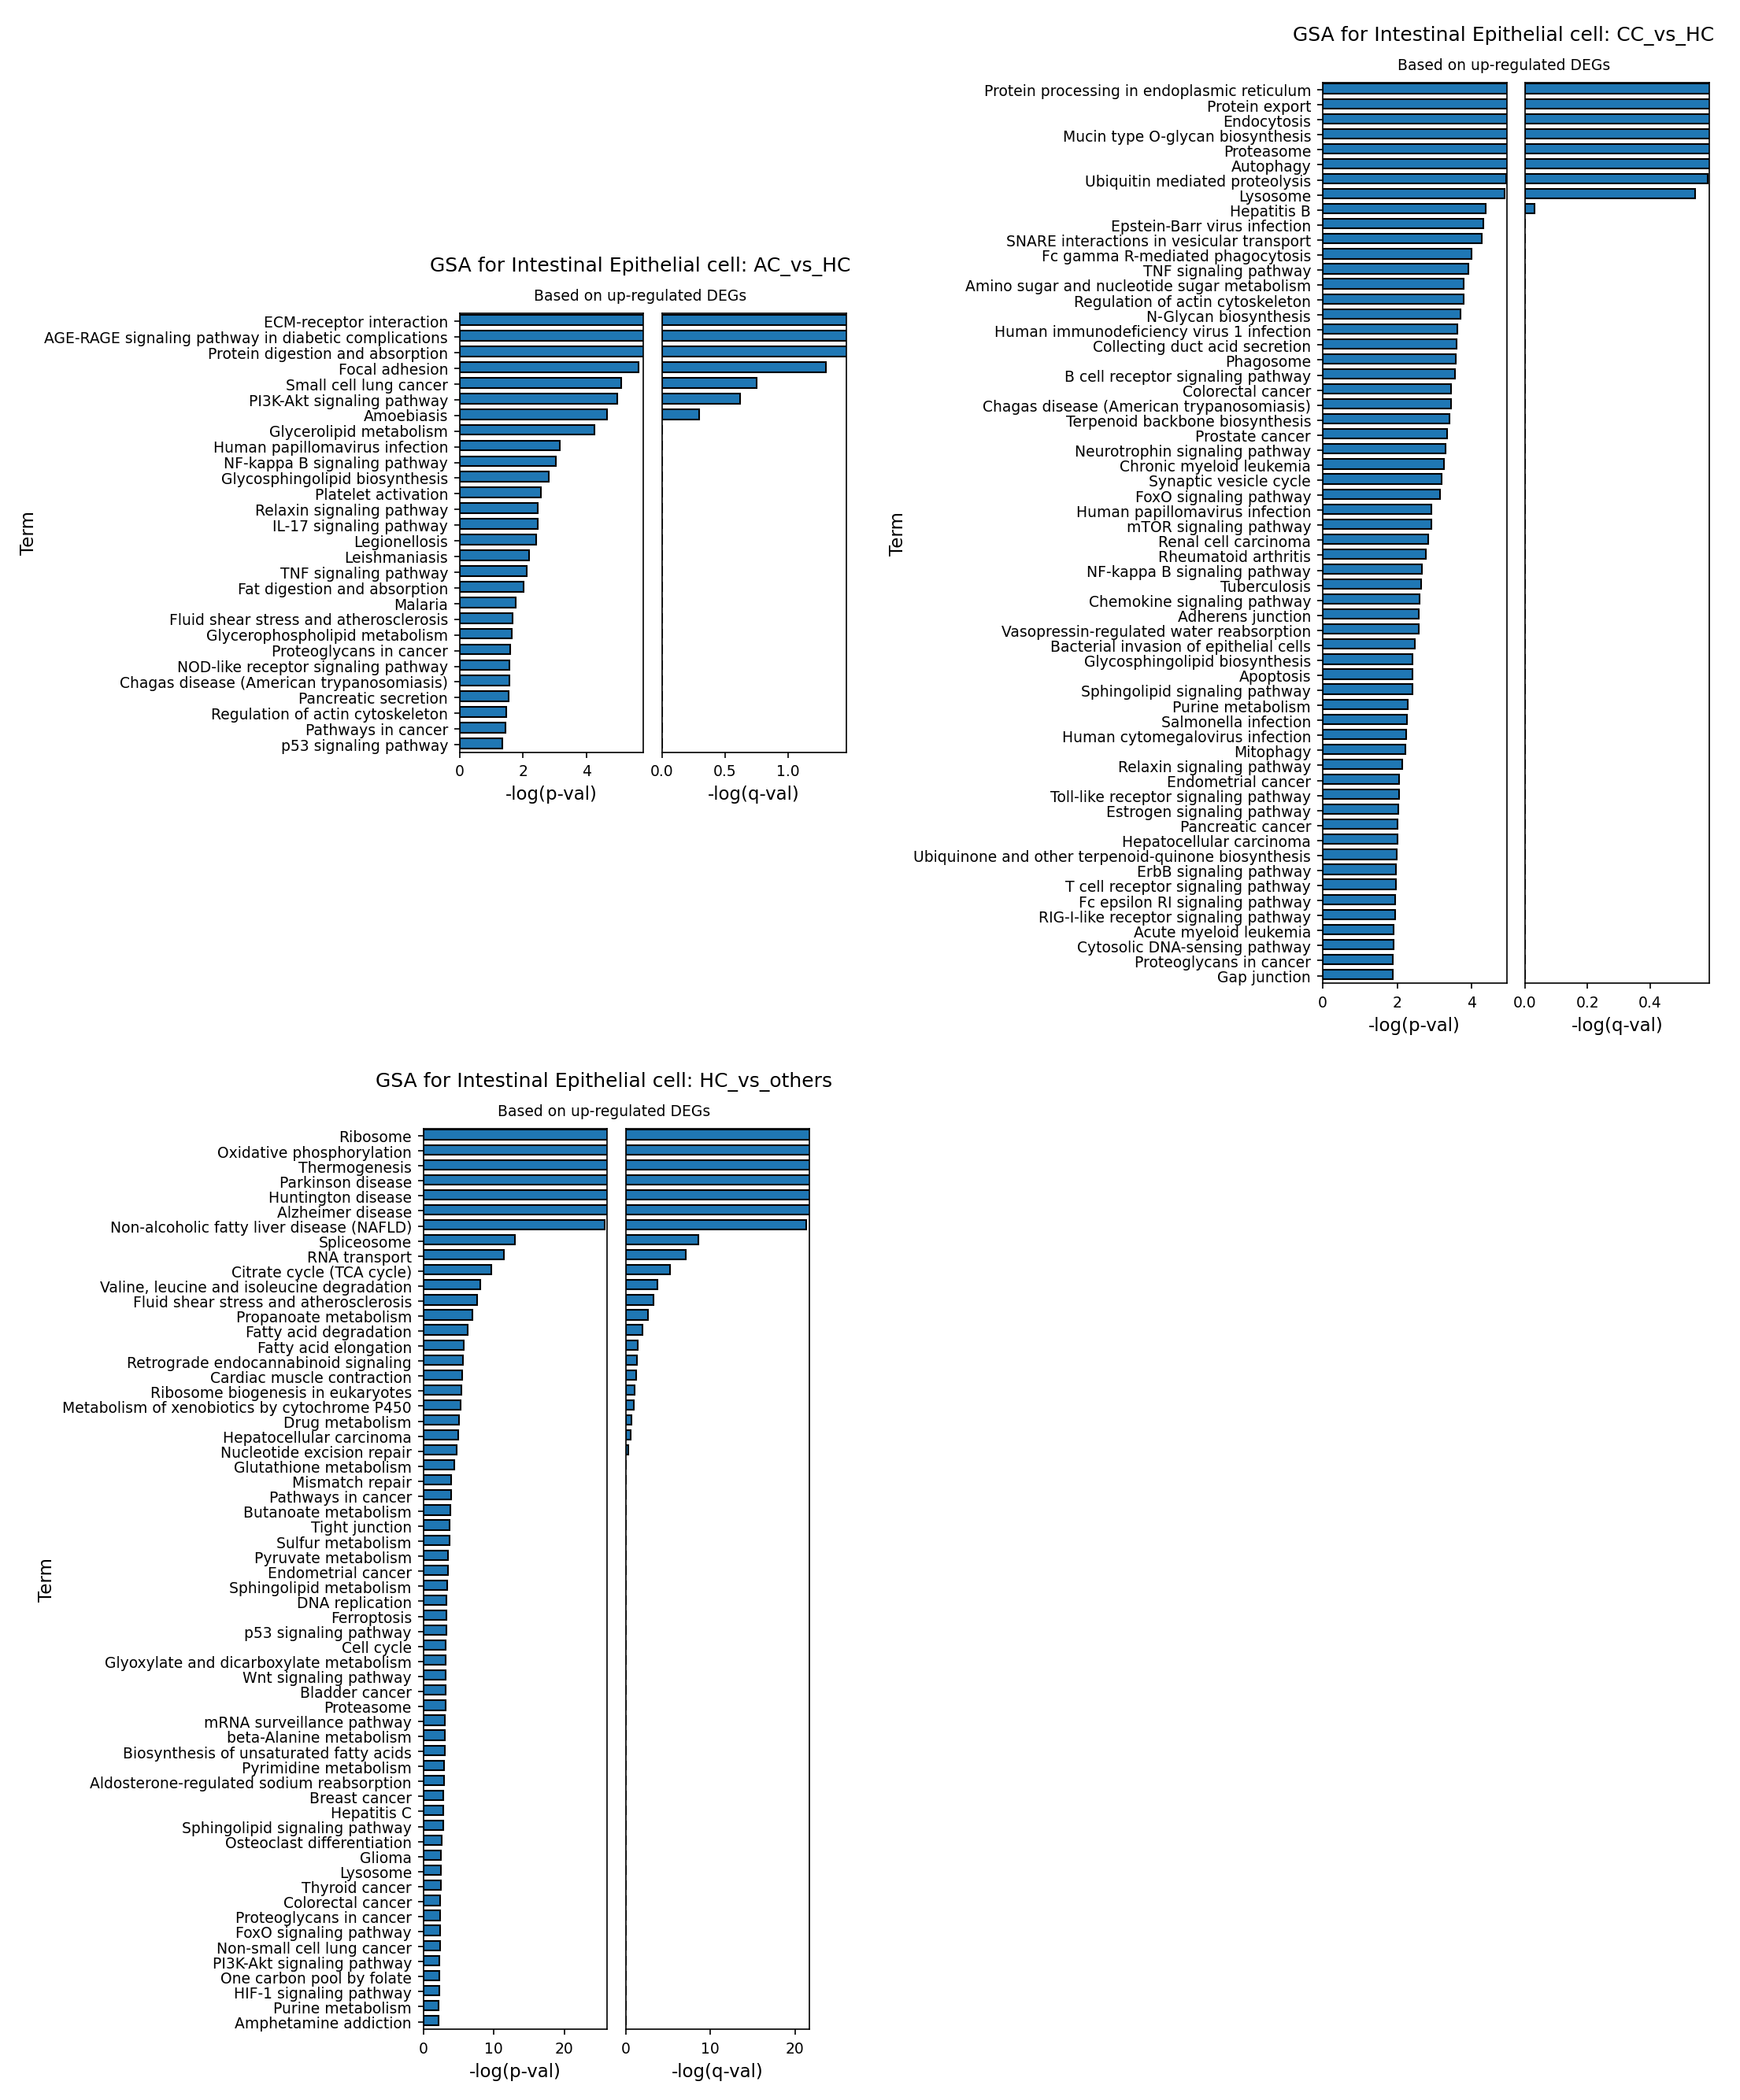
[Analysis Visualization Results]...
Analysis Overview
This analysis investigates the Gene Ontology (GO) enrichment of up-regulated differentially expressed genes (DEGs) in Intestinal Epithelial cells (IECs) across different experimental conditions, comparing them against a healthy control (HC) group. Specifically, it examines genes up-regulated in Acute Colitis (AC) versus HC, Chronic Colitis (CC) versus HC, and genes up-regulated in HC versus other conditions (AC and CC combined). The results are presented as bar plots, illustrating the significance of enriched GO terms based on -log(p-val) and -log(q-val). This helps to identify biological processes and pathways that are specifically altered in IECs during acute and chronic phases of colitis compared to a healthy state, and vice versa.
Visual Summary
The provided bar plots display the top Gene Ontology terms enriched for up-regulated genes in Intestinal Epithelial cells under three distinct comparisons:
- GSA for Intestinal Epithelial cell: AC_vs_HC (Based on up-regulated DEGs): This plot shows terms enriched in Acute Colitis (AC) compared to Healthy Controls (HC). The top terms include "ECM-receptor interaction," "AGE-RAGE signaling pathway," "Protein digestion and absorption," and "Focal adhesion." Many terms show high statistical significance, with -log(p-val) ranging up to ~5.5 and -log(q-val) up to ~1.25.
- GSA for Intestinal Epithelial cell: CC_vs_HC (Based on up-regulated DEGs): This plot highlights terms enriched in Chronic Colitis (CC) compared to HC. Prominent terms are "Protein processing in endoplasmic reticulum," "Protein export," "Endocytosis," "Mucin type O-glycan biosynthesis," "Proteasome," and "Autophagy." The -log(p-val) values extend up to ~4.5, and -log(q-val) up to ~0.5.
- GSA for Intestinal Epithelial cell: HC_vs_others (Based on up-regulated DEGs): This plot identifies terms enriched in HC compared to both AC and CC conditions. The most significant terms include "Ribosome," "Oxidative phosphorylation," "Thermogenesis," "Spliceosome," and "RNA transport." This comparison exhibits the highest statistical significance among the three plots, with -log(p-val) reaching over 20 and -log(q-val) over 20 for the top terms, suggesting very strong and distinct activity in healthy cells.
Overall, each plot reveals a unique set of significantly enriched pathways, reflecting distinct cellular responses and states of Intestinal Epithelial cells during acute inflammation, chronic inflammation, and healthy homeostasis. The differences in the magnitude of -log(p-val) and -log(q-val) also suggest varying degrees of gene set enrichment across the conditions.
Biological Interpretation
The Gene Ontology analysis provides critical insights into the functional shifts of Intestinal Epithelial cells (IECs) in the context of colitis.
Intestinal Epithelial Cell Responses in Acute Colitis (AC vs. HC)
In acute colitis, Intestinal Epithelial cells show an up-regulation of pathways indicative of immediate stress, tissue remodeling, and early inflammatory responses:
- ECM-receptor interaction and Focal adhesion: These terms suggest changes in cell-extracellular matrix communication and cell adhesion, which are crucial for maintaining epithelial barrier integrity and are often disrupted or undergoing repair during inflammation [1].
- AGE-RAGE signaling pathway in diabetic complications: While the term specifies "diabetic complications," the AGE-RAGE axis is a known mediator of inflammation, oxidative stress, and tissue damage in various inflammatory conditions, including inflammatory bowel disease (IBD), where RAGE is expressed by epithelial cells and can perpetuate inflammation [2].
- PI3K-Akt signaling pathway and NF-kappa B signaling pathway: These are central signaling hubs involved in cell survival, proliferation, and the activation of inflammatory gene expression. Their up-regulation indicates an active inflammatory response and attempts at cellular adaptation or repair.
- Protein digestion and absorption, Glycerolipid metabolism: Changes in these metabolic pathways could reflect alterations in nutrient processing or energy demands of IECs under acute inflammatory stress.
Intestinal Epithelial Cell Responses in Chronic Colitis (CC vs. HC)
In chronic colitis, IECs display an up-regulation of pathways associated with sustained cellular stress, protein quality control, and persistent immune signaling:
- Protein processing in endoplasmic reticulum, Proteasome, Ubiquitin mediated proteolysis, Autophagy, and Lysosome: The strong enrichment of these pathways collectively points to significant cellular stress and increased demand for protein folding, degradation, and recycling. This is a common cellular response to chronic damage and inflammation, aiming to clear damaged components and maintain cellular homeostasis [3].
- Mucin type O-glycan biosynthesis and N-Glycan biosynthesis: Alterations in glycosylation patterns are frequently observed in inflammatory conditions and can affect the composition of the mucus layer, cell surface receptor function, and immune recognition by the epithelial barrier.
- TNF signaling pathway: This pathway is a prominent driver of inflammation in colitis. Its activation in IECs suggests their direct involvement in perpetuating chronic inflammatory cycles by responding to and potentially producing inflammatory cytokines.
- Regulation of actin cytoskeleton: Changes here can impact epithelial barrier function, cell migration, and cell-cell junctions, all of which are critical for maintaining gut integrity in chronic inflammation.
Intestinal Epithelial Cell Characteristics in Healthy Controls (HC vs. others)
The pathways up-regulated in healthy IECs, when compared to colitis conditions, highlight fundamental cellular processes that are likely suppressed or dysregulated during disease:
- Ribosome, Spliceosome, RNA transport: These terms indicate high levels of protein synthesis and gene expression machinery, essential for the rapid turnover and continuous function of IECs in maintaining a healthy gut lining. Their down-regulation in colitis would imply impaired cellular maintenance and repair.
- Oxidative phosphorylation, Citrate cycle (TCA cycle), Thermogenesis: These core metabolic pathways are central to energy production. Their robust activity in healthy IECs suggests a state of high metabolic efficiency to support their demanding functions, which can be significantly altered during inflammatory conditions as cells shift their metabolic strategies.
- Valine, leucine and isoleucine degradation: This indicates active amino acid metabolism in healthy IECs, contributing to energy production and cellular building blocks.
- The presence of disease terms like "Parkinson disease," "Huntington disease," and "Alzheimer disease" in the HC vs. others plot likely reflects shared underlying cellular processes, such as mitochondrial function and protein homeostasis, which are robust in healthy cells but become dysfunctional in various disease states.
Clinical or Translational Implications
The distinct pathway enrichments in Intestinal Epithelial cells during acute and chronic colitis offer valuable insights with potential clinical and translational relevance:
- Biomarkers of Disease Progression: The differential activation of pathways (e.g., ECM-receptor interaction and NF-κB in AC vs. protein processing and autophagy in CC) could serve as potential stage-specific biomarkers for distinguishing acute exacerbations from chronic disease states in colitis.
- Therapeutic Targets: Pathways consistently activated in colitis, such as the NF-κB signaling pathway (AC) and TNF signaling pathway (CC), are well-established therapeutic targets for inflammatory bowel disease. Moreover, the prominence of stress-response pathways (ER stress, proteasome, autophagy) in chronic colitis suggests that interventions aimed at ameliorating cellular stress or restoring protein homeostasis in IECs could be beneficial.
- Epithelial Barrier Integrity: The changes in ECM interactions, focal adhesion, and actin cytoskeleton regulation underline the critical role of the epithelial barrier in colitis. Strategies to reinforce or repair the intestinal barrier, potentially by modulating these pathways, could be explored as adjunctive therapies.
- Metabolic Reprogramming: The clear shift from robust metabolic activity in healthy IECs (oxidative phosphorylation, TCA cycle) to altered metabolic states in colitis suggests that targeting metabolic reprogramming within IECs could be a novel therapeutic avenue for managing inflammation and promoting tissue repair.
Understanding these epithelial cell-intrinsic responses is crucial for developing targeted therapies that not only suppress inflammation but also support the recovery and function of the intestinal lining, which is vital for long-term disease remission in colitis.
References
[1] Review on epithelial barrier function: PubMed Search: "intestinal epithelial barrier inflammation"
[2] AGE-RAGE axis in inflammation: UniProt: P28330 (AGER_MOUSE)
[3] Autophagy and ER stress in IBD: PubMed Search: "autophagy ER stress inflammatory bowel disease"
16. Gene Set Enrichment Analysis of Colitis Conditions Across Colon Cell Types
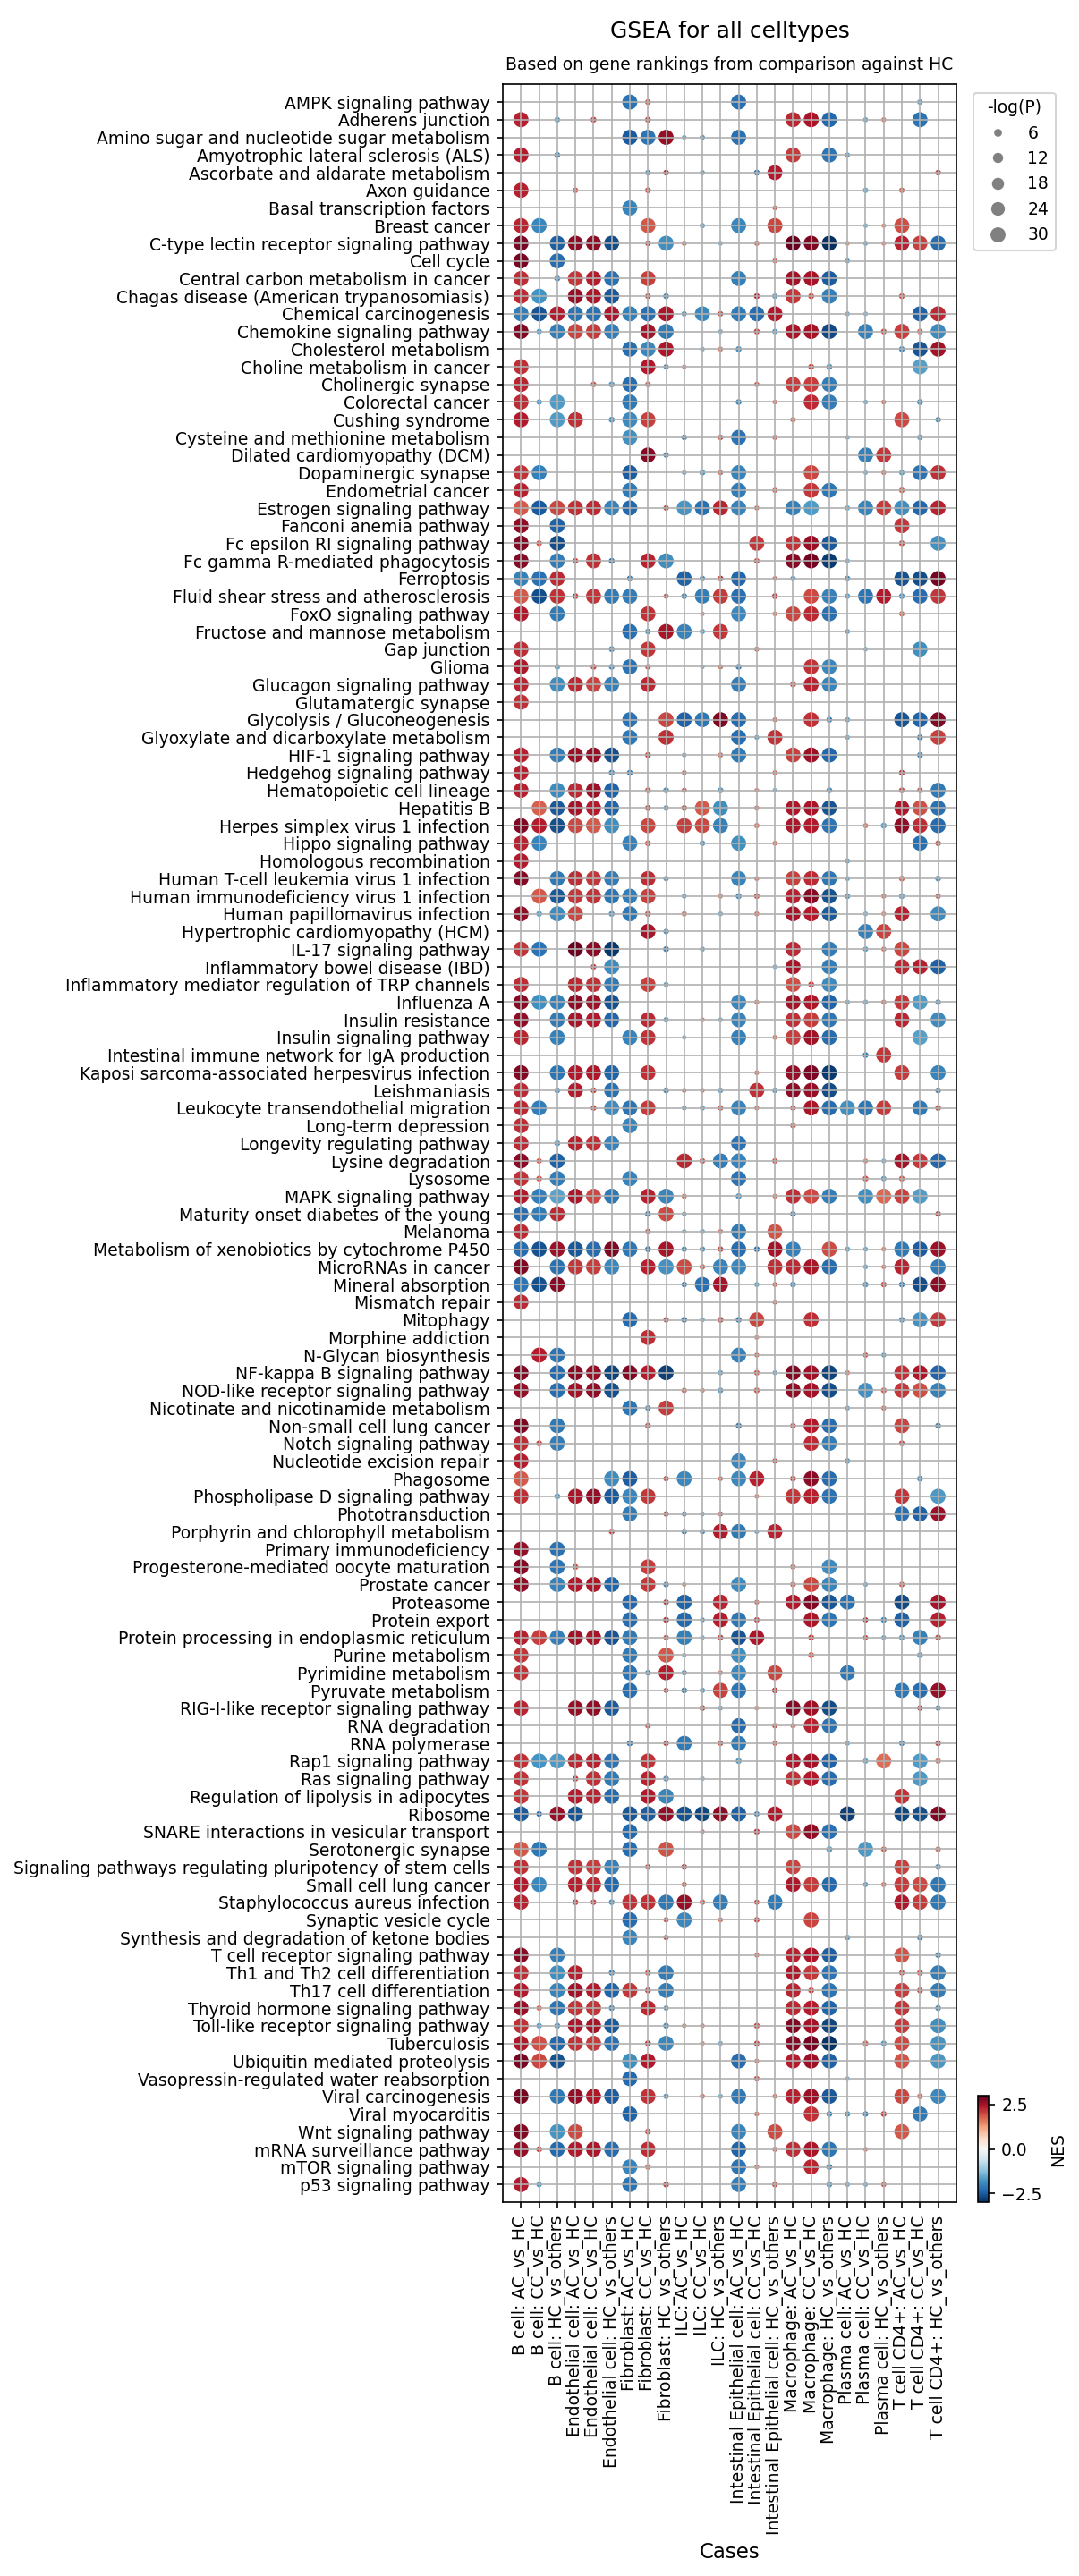
[Analysis Visualization Results]...
Analysis Overview
This analysis presents Gene Set Enrichment Analysis (GSEA) results across various cell types in the mouse colon under Acute Colitis (AC) and Chronic Colitis (CC) conditions, compared to a Healthy Control (HC) reference. The dot plot visualizes the Normalized Enrichment Score (NES) by color (red for positive NES, blue for negative NES) and the statistical significance (-log(p-val)) by dot size for a comprehensive set of biological pathways. The primary goal is to identify pathways that are significantly altered in different cell types during acute and chronic stages of colitis.
Visual Summary
The dot plot effectively displays the enrichment patterns of 120 gene sets across 9 major cell types (B cell, Dendritic cell, Endothelial cell, Fibroblast, ILC, Intestinal Epithelial cell, Macrophage, Plasma cell, T cell CD4+) and three comparison conditions: Acute Colitis vs Healthy Control (AC vs HC), Chronic Colitis vs Healthy Control (CC vs HC), and Healthy Control vs Others (HC vs others).
- Widespread Pathway Alterations: Numerous pathways show significant enrichment (red dots) or depletion (blue dots) across most cell types in both AC vs HC and CC vs HC comparisons, indicated by large dot sizes. This signifies a broad impact of colitis on cellular biology.
- Dominant Inflammatory/Immune Activation: A prominent pattern is the strong enrichment of pathways related to inflammation and immune responses (e.g., "Inflammatory bowel disease (IBD)", "NF-kappa B signaling pathway", "MAPK signaling pathway", "Chemokine signaling pathway", "IL-17 signaling pathway", "Toll-like receptor signaling pathway", "Th1 and Th2 cell differentiation", "Leukocyte transendothelial migration") in almost all investigated cell types under AC and CC conditions compared to HC.
- Metabolic Reprogramming: Several metabolic pathways exhibit altered enrichment. "Glycolysis / Gluconeogenesis", "Pentose phosphate pathway", "Purine metabolism", and "Pyrimidine metabolism" are generally enriched, while "Oxidative phosphorylation", "PPAR signaling pathway", and "Cholesterol metabolism" are often depleted across multiple cell types during colitis.
- Cell Proliferation and Stress Responses: "Cell cycle", "Protein processing in endoplasmic reticulum", "Ribosome", "Proteasome", and "Ubiquitin mediated proteolysis" pathways are frequently enriched, suggesting increased cellular activity, proliferation, and stress responses in disease states.
- HC vs Others Contrast: The "HC vs others" columns generally show an inverse pattern to the AC/CC vs HC comparisons, with inflammatory pathways typically depleted (blue dots) in healthy controls compared to the combined diseased states, confirming the disease-associated nature of the observed enrichments.
- Similarities Between AC and CC: Many pathways show comparable enrichment patterns and magnitudes in both acute and chronic colitis, suggesting common underlying inflammatory mechanisms. While subtle differences in intensity or extent may exist, a clear distinction of unique pathway signatures for AC versus CC is not immediately apparent from this overview.
Biological Interpretation
The GSEA results provide robust biological insights into the pathogenesis of colitis in the mouse colon model:
- Hallmarks of Inflammation: The consistent and widespread upregulation of key inflammatory signaling pathways (NF-κB, MAPK, IL-17, TLR, NOD-like receptor, Chemokine signaling) across immune cells (Macrophages, Dendritic cells, T cells, B cells, ILCs, Plasma cells), stromal cells (Fibroblasts, Endothelial cells), and especially Intestinal Epithelial cells, unequivocally confirms a strong inflammatory response characteristic of colitis. The direct enrichment of the "Inflammatory bowel disease (IBD)" pathway serves as a strong biological validation of the disease model.
- NF-κB is a central regulator of immune and inflammatory responses PubMed search: NF-kappa B signaling inflammation.
- IL-17 signaling is crucial in host defense and inflammatory diseases, including IBD PubMed search: IL-17 signaling inflammatory bowel disease.
- Chemokine signaling orchestrates the recruitment of immune cells to sites of inflammation PubMed search: chemokine signaling immune cell recruitment.
- Immune Cell Activation and Recruitment: Immune cell types such as Macrophages, Dendritic cells, and T cells (CD4+) show enrichment for pathways like "Th1 and Th2 cell differentiation", "Fc gamma R-mediated phagocytosis", and "Phagosome", indicating active immune responses, antigen presentation, and cellular clearance mechanisms. The enrichment of "Leukocyte transendothelial migration" in Endothelial cells and other cells underscores the critical process of immune cell infiltration into the inflamed colon tissue.
- Metabolic Reprogramming in Colitis: The shifts in metabolism, particularly the enrichment of glycolysis and depletion of oxidative phosphorylation in multiple cell types (e.g., Macrophages, Fibroblasts, Endothelial cells), suggest a "Warburg-like" metabolic reprogramming. This shift towards aerobic glycolysis is a known feature of activated immune cells and proliferating cells in inflammatory microenvironments, providing rapid ATP and biosynthetic precursors PubMed search: Warburg effect immune cells inflammation. Downregulation of lipid metabolism pathways (e.g., PPAR signaling, Cholesterol metabolism, Fatty acid degradation) also reflects altered metabolic states in inflamed tissue.
- Epithelial Dysfunction and Repair: Intestinal Epithelial cells exhibit significant activation of inflammatory pathways, but also show enrichment in "Cell cycle" and "Adherens junction" pathways. This suggests increased proliferation attempts, possibly reflecting a regenerative response to epithelial damage, alongside potential disruptions in barrier integrity, as adherens junctions are critical for maintaining epithelial barrier function. The downregulation of pathways related to epithelial function like "Vasopressin-regulated water reabsorption" also points to functional alterations.
- Stromal Cell Involvement: Fibroblasts and Endothelial cells are not merely passive bystanders but actively participate in the inflammatory process, showing similar inflammatory and metabolic pathway enrichments to immune cells. Fibroblasts play a critical role in tissue remodeling, fibrosis, and immune cell recruitment in chronic inflammation PubMed search: fibroblast role colitis inflammation.
- Potential Viral Reactivation/Response: The enrichment of several viral infection pathways (e.g., "Herpes simplex virus 1 infection", "Human papillomavirus infection") in various cell types during colitis could indicate a generalized antiviral innate immune response, or potentially, opportunistic viral reactivation in an inflamed and immunosuppressed (at tissue level) environment.
Clinical or Translational Implications
The comprehensive GSEA results highlight several areas with potential clinical and translational relevance for colitis:
- Therapeutic Targets: Pathways consistently activated across multiple cell types in both acute and chronic colitis, such as NF-κB, MAPK, IL-17 signaling, and chemokine signaling, represent well-established and emerging targets for anti-inflammatory therapies in IBD. Targeting specific components within these pathways, or modulators of the associated metabolic shifts, could offer novel therapeutic strategies.
- Biomarkers of Disease Activity: The specific enrichment patterns in different cell types could potentially yield novel biomarkers. For instance, epithelial-specific changes in cell cycle or junctional pathways could indicate the extent of mucosal damage and repair. Similarly, metabolic pathway alterations in immune cells might serve as indicators of disease activity or response to treatment.
- Understanding Disease Progression: While AC and CC showed broadly similar pathway enrichments, closer examination of the relative magnitudes and specific cell-type contributions could reveal pathways that are uniquely sustained or further amplified in chronic disease, informing strategies for preventing chronicity or managing persistent inflammation.
- Targeting Metabolic Reprogramming: The observed metabolic shifts, particularly the glycolytic switch, suggest that modulating cellular metabolism could be a viable therapeutic approach to dampen inflammatory responses and support tissue repair in colitis.
- Cell-Type Specific Interventions: The cell-type-specific nature of many enriched pathways underscores the importance of developing therapies that either broadly target critical inflammatory hubs or selectively act on key contributing cell populations (e.g., anti-inflammatory strategies specifically for macrophages or epithelial cells).
17. Discussion
This single-cell RNA sequencing analysis provides a high-resolution view of the cellular and molecular landscape in mouse colon during acute and chronic colitis. The UMAP visualizations confirm robust cell type identification, revealing distinct cellular states for healthy controls, while acute and chronic colitis conditions largely overlap, suggesting shared inflammatory processes. However, a deeper dive into cell population dynamics, marker expression, and pathway enrichment uncovers critical differences and commonalities underpinning disease progression.
Key observations highlight a profound immune cell infiltration and activation in colitis. B cells, particularly, show a dramatic expansion, becoming a predominant cell type in chronic colitis samples, indicative of a robust humoral immune response and potentially sustained inflammation. Concurrently, T cell populations undergo significant shifts: a reduction in naive T cells, an increase in pro-inflammatory Th17 and Th22 subsets (especially in acute colitis), and a compensatory increase in regulatory T cells (Tregs) in both acute and chronic phases. Notably, cytotoxic T cells are significantly reduced in chronic colitis, suggesting a potential immune evasion mechanism or a shift in effector functions. Macrophages also exhibit a clear pro-inflammatory M1 phenotype dominance in both acute and chronic colitis, with a transient increase in M2B macrophages in acute colitis and a consistent reduction of M2D macrophages, suggesting a complex and dynamic macrophage polarization spectrum.
Intestinal epithelial cells (IECs) demonstrate widespread dysfunction and attempted repair. Their proportion decreases progressively from healthy to chronic colitis, indicative of epithelial damage. Analysis of surfaceome markers in IECs revealed upregulation of Duox2, Prom1 (CD133), and Egfr in colitis, pointing to increased oxidative stress, regenerative attempts, and dysregulated growth. Conversely, markers of healthy epithelial homeostasis like Lgr4 and Dpp4 were downregulated in colitis. Pathway analysis confirmed this, showing enrichment of ECM-receptor interaction and NF-κB signaling in acute colitis, and protein processing, proteasome, and autophagy pathways in chronic colitis, reflecting sustained cellular stress and protein quality control issues. Healthy IECs, in contrast, were highly enriched for ribosomal, oxidative phosphorylation, and TCA cycle pathways, signifying high metabolic and synthetic activity.
Stromal fibroblasts also play a critical role, transitioning from a quiescent state in healthy tissue (marked by Pdgfra, Cd34) to activated, pro-fibrotic phenotypes in colitis. Acute colitis fibroblasts showed upregulation of Il1r1 and Osmr, indicating early inflammatory and pro-fibrotic signaling. In chronic colitis, Pdgfrb and Ednra were highly expressed, robustly signaling active fibrogenesis. Similarly, CD4+ T cells in colitis showed upregulation of adhesion molecules (Itga4) and co-stimulatory receptors (Tnfrsf4, Tnfrsf9), reflecting increased activation and tissue homing, while healthy T cells expressed markers of naive or recirculating cells (Ccr7, S1pr1).
Cell-cell interaction analysis further elucidated the intricate communication networks. Colitis conditions showed a pervasive increase in significant interactions involving adhesion molecules (VCAM1-integrin, MADCAM1-integrin), inflammatory signaling (TNF-TNFRSF1B), tissue remodeling (TGFB2-TGFbeta_receptor1, integrin-collagen), and angiogenesis (DLL4-NOTCH1). These findings underscore how diverse cell types coordinate their responses in the inflamed colon. The consistent activation of pathways such as NF-κB, MAPK, IL-17, and TLR signaling across multiple cell types in both acute and chronic colitis is a hallmark of inflammation. The metabolic reprogramming towards glycolysis in activated immune and stromal cells further reflects the energetic demands of inflammation.
Overall, our data provides a detailed map of the dynamic cellular and molecular changes during colitis progression. The pronounced B cell expansion in chronic colitis, coupled with specific macrophage and fibroblast activation states, suggests a shift towards a more B cell-mediated and fibrotic pathology in chronicity. The comprehensive nature of the analysis highlights distinct stage-specific mechanisms and potential therapeutic opportunities beyond currently established treatments.
Hypotheses:
- The sustained expansion of B cells, particularly in chronic colitis, contributes significantly to ongoing inflammation and tissue damage through antibody production and antigen presentation, shifting the disease's immunological drivers from acute to chronic phases.
- The shift in Intestinal Epithelial cells from high metabolic and synthetic activity in health to increased stress response pathways (ER stress, proteasome, autophagy) in chronic colitis represents a maladaptive response that compromises barrier integrity and perpetuates inflammation.
- Macrophage M1 dominance and altered M2 subset proportions (decreased M2D, transient M2B) in colitis reflect a failure of inflammatory resolution mechanisms and drive persistent tissue destruction and immune activation.
- The differential expression of fibroblast surfaceome markers, particularly Pdgfrb and Ednra in chronic colitis, directly correlates with distinct fibrotic activation states, contributing to stricture formation and tissue remodeling.
- Dysregulated cell-cell communication, exemplified by increased VCAM1-integrin and MADCAM1-integrin interactions, drives the recruitment and retention of pathogenic immune cells in the inflamed colon, sustaining chronic inflammation.
Potential therapeutic targets:
- PDGFRB (Platelet-derived growth factor receptor beta): PDGFRB is highly upregulated in chronic colitis fibroblasts, indicating active fibrogenesis. Its activation drives fibroblast proliferation, differentiation into myofibroblasts, and extracellular matrix synthesis, leading to intestinal fibrosis and stricture formation. Evidence: Fibroblast condition-specific markers show robust upregulation of Pdgfrb in chronic colitis (Section 13). Its ligand PDGF-BB is a potent mitogen and chemoattractant for fibroblasts, central to fibrogenesis (Section 13, PubMed: 29581373). Validation: Test specific PDGFRB inhibitors (e.g., tyrosine kinase inhibitors like imatinib) in mouse models of chronic colitis to evaluate reduction in fibrosis, collagen deposition, and stricture formation. Monitor fibroblast activation markers and ECM remodeling.
- Integrin α4β7 (MADCAM1-integrin_a4b7_complex): This integrin mediates lymphocyte homing to the gut, and its interaction with MADCAM1 on endothelial cells is crucial for immune cell infiltration into inflamed intestinal mucosa, perpetuating chronic inflammation. Evidence: Condition-specific CCI patterns show significant upregulation of MADCAM1-integrin_a4b7_complex in both acute and chronic colitis (Section 10). T cell CD4+ markers show upregulation of Itga4 (alpha-4 subunit of integrin α4β7) in colitis (Section 14). Validation: Clinical validation exists with Vedolizumab (an anti-integrin α4β7 antibody) for IBD. Further studies can use genetic models or pharmacological agents to specifically block α4β7 or MADCAM1 in mouse colitis models and assess leukocyte trafficking and inflammatory burden.
- TNF (Tumor Necrosis Factor): TNF is a central pro-inflammatory cytokine driving widespread inflammation, tissue damage, and immune cell recruitment in colitis, acting across multiple cell types. Evidence: CCI analysis shows strong TNF-TNFRSF1B interaction, particularly involving macrophages and ILCs, in acute and chronic colitis (Section 10). GSEA reveals widespread enrichment of TNF signaling pathways across various cell types in colitis (Section 16). Macrophage surfaceome shows upregulation of Tnfrsf1b (TNFR2) in acute colitis (Section 12). Validation: Anti-TNF biologics (e.g., Infliximab, Adalimumab) are established IBD treatments. Preclinical validation in mouse models has shown efficacy in reducing inflammation. Further studies can investigate novel TNF inhibitors or combination therapies targeting specific TNF signaling components.
- IL-1R1 (Interleukin 1 receptor type 1): IL-1R1 initiates powerful inflammatory signaling cascades in response to IL-1α/β, contributing to acute inflammatory responses and tissue damage in colitis, particularly in fibroblasts and epithelial cells. Evidence: Fibroblast condition-specific markers show upregulation of Il1r1 in acute colitis (Section 13). GSEA indicates enrichment of IL-17 signaling and NF-κB signaling pathways, often downstream of IL-1R1, in colitis (Section 16). Validation: Anakinra, an IL-1 receptor antagonist, is used in other inflammatory diseases. Testing IL-1R1 antagonists in acute colitis models could assess their ability to dampen early inflammatory responses and prevent disease chronicity. Investigate effects on fibroblast activation and cytokine production.
- CCR2 (Chemokine (C-C motif) receptor 2): CCR2 is critical for the continuous recruitment of monocytes and macrophages to the inflamed colon, sustaining the inflammatory cellular infiltrate characteristic of chronic colitis. Evidence: Macrophage condition-specific markers show pronounced upregulation of Ccr2 in chronic colitis (Section 12). Chemokine signaling pathways are widely enriched in colitis in various cell types (Section 16). Validation: CCR2 antagonists are under investigation for inflammatory diseases. Evaluate CCR2 antagonists in mouse models of chronic colitis to assess their efficacy in reducing macrophage infiltration, inflammation, and tissue damage.
Follow-up validation ideas:
- Flow Cytometry/Immunohistochemistry: Validate population shifts and marker expression (e.g., B cell numbers, Th17/Treg ratios, M1/M2 markers like CD68/CD163/CD206, specific surfaceome markers like PDGFRB on fibroblasts) in independent cohorts of mouse colitis models and patient biopsies to confirm findings at the protein level.
- Spatial Transcriptomics/FISH: Spatially map the identified cell-cell interactions (e.g., VCAM1-integrin, TNF-TNFRSF1B) and condition-specific markers (e.g., Duox2 in IECs, Pdgfrb in fibroblasts) within the colon tissue to understand their precise anatomical localization and contribution to disease pathology.
- Perturbation Assays (In vitro/Ex vivo): Use organoid cultures, co-culture systems (e.g., epithelial-immune-stromal cell mixes), or specific cell lines to functionally validate key cell-cell interactions or marker roles. For example, block specific integrins or cytokine receptors using neutralizing antibodies or small molecule inhibitors and observe effects on cell migration, proliferation, or inflammatory cytokine production.
- In vivo Functional Studies: Utilize genetic knockout/knockdown models (e.g., conditional deletion of a specific receptor in a particular cell type) or pharmacological inhibitors targeting identified therapeutic targets (e.g., PDGFRB inhibitors) in established mouse colitis models (DSS-induced, TNBS-induced) to assess their impact on disease severity, inflammation, and fibrosis.
- Bulk or Single-Cell Validation Cohorts: Analyze independent patient cohorts with acute and chronic IBD using bulk RNA-seq or single-cell RNA-seq to confirm the observed gene expression and pathway enrichments in human disease, establishing translational relevance.
Limitations:
This study is based on a mouse model of colitis, and findings may not fully translate to human inflammatory bowel disease due to species-specific differences in immunology and disease progression. The exact experimental induction method for colitis (e.g., DSS, TNBS) was not provided, which limits the precise mechanistic interpretation of acute versus chronic phases. While single-cell RNA-seq provides high-resolution insights, it offers a snapshot of gene expression and does not directly measure protein activity or cellular function. The inferred disease context of 'Colitis' is based on metadata and common usage of 'AC' and 'CC' conditions; specific clinical diagnoses or severity scores are not available. Future work integrating proteomics, functional assays, and human validation cohorts would strengthen these findings.
18. Query List
- Show and save UMAPs for condition, sample, major cell type, minor cell type, and celltype_subset in two columns.
- Show major cell type scores on UMAP and save the result.
- Show and save a marker expression dot plot for celltype_subset. SET target_cell = None and var_group_rotation = 45. Leave all other arguments at their default values.
- Show and save a population bar plot of minor cell types.
- Show and save a population bar plot of T cell subsets.
- Show and save box plots of T cell subset populations with statistically significant differences between conditions, if any. Choose ncols based on the total number of panels.
- Show and save a population bar plot of macrophage subsets.
- Show and save box plots of macrophage subset populations with statistically significant differences between conditions, if any. Choose ncols based on the total number of panels.
- Show and save cell-cell interaction patterns. Select at most 80 cell-cell interactions per group.
- Find cell-cell interactions involving major tissue cells, immune cells and stromal cells that differ significantly between conditions, show them as a dot plot, and save the result. Set max_n_items_per_group to 60. For each interaction identified under each condition, using the provided dataset context, describe the associated signaling pathways and mechanisms and, where relevant, its potential as a therapeutic target and related therapeutic agents.
- Show marker expressions for Intestinal Epithelial cell in a dot plot, and save the result. Use only surfaceome markers, with at most 50 markers per condition. For each marker identified under each condition, using the provided dataset context, describe the associated signaling pathways and biological mechanisms within the Colon tissue and, where relevant, its potential as a therapeutic target for Colitis and related therapeutic agents.
- Show marker expressions for Macrophage in a dot plot, and save the result. Use only surfaceome markers, with at most 40 markers per condition. For each marker identified under each condition, using the provided dataset context, describe the associated signaling pathways and biological mechanisms within the Colon tissue and, where relevant, its potential as a therapeutic target for Colitis and related therapeutic agents.
- Show marker expressions for Fibroblast in a dot plot, and save the result. Use only surfaceome markers, with at most 40 markers per condition. For each marker identified under each condition, using the provided dataset context, describe the associated signaling pathways and biological mechanisms within the Colon tissue and, where relevant, its potential as a therapeutic target for Colitis and related therapeutic agents.
- Show marker expressions for T cell CD4+ in a dot plot, and save the result. Use only surfaceome markers, with at most 40 markers per condition. For each marker identified under each condition, using the provided dataset context, describe the associated signaling pathways and biological mechanisms within the Colon tissue and, where relevant, its potential as a therapeutic target for Colitis and related therapeutic agents.
- Show Gene Ontology (GSA) analysis results for Intestinal Epithelial cell as a bar plot, and save the result.
- Show Gene Set Enrichment Analysis results as a dot plot, and save it. Set the color map to RdBu_r, n_pws_to_show to 120, and target_cells to None.